Fig. 2
Download original image
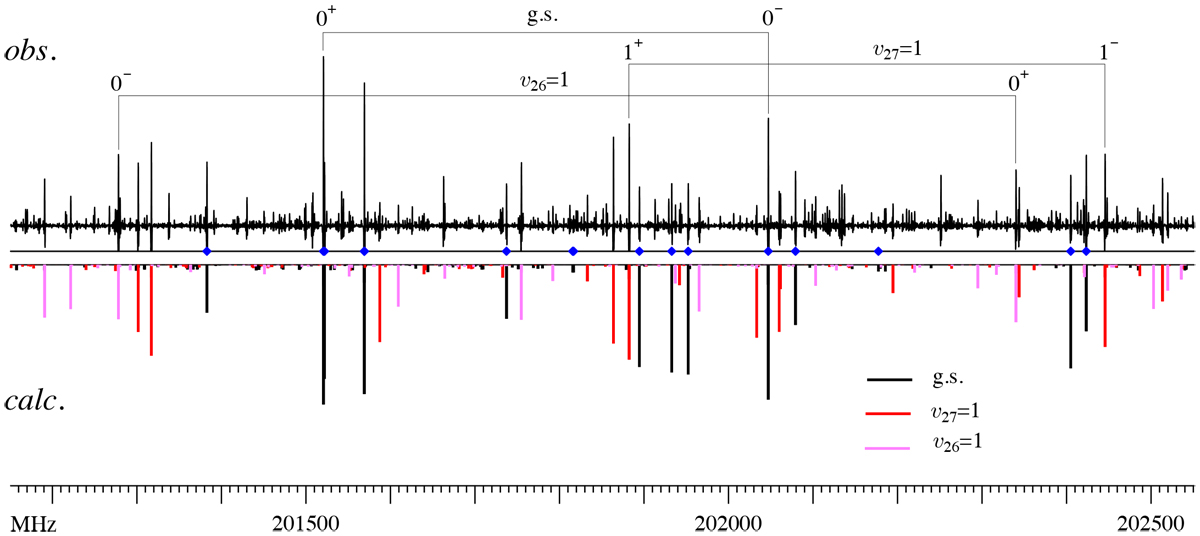
Sample 1.4 GHz of the rotational spectrum of glycinamide at 50°C illustrating the absence of characteristic spectral patterns. Overbars in the experimental spectrum (top panel) mark J = 34 ← 33 transitions between rotational levels with Ka = 0 and 1,with each marked line corresponding to an overlap of a pair of stronger μa-dipole, and a pair of weaker μb-dipole transitions. The frequency span of the bar indicates the significant magnitude of the splitting between two substates for each of the three tunnelling doublets. Blue markers indicate ground-state transitions in the data set used for determining spectroscopic constants, while the bottom panel displays collected predictions made on the basis of the final fits.
Current usage metrics show cumulative count of Article Views (full-text article views including HTML views, PDF and ePub downloads, according to the available data) and Abstracts Views on Vision4Press platform.
Data correspond to usage on the plateform after 2015. The current usage metrics is available 48-96 hours after online publication and is updated daily on week days.
Initial download of the metrics may take a while.