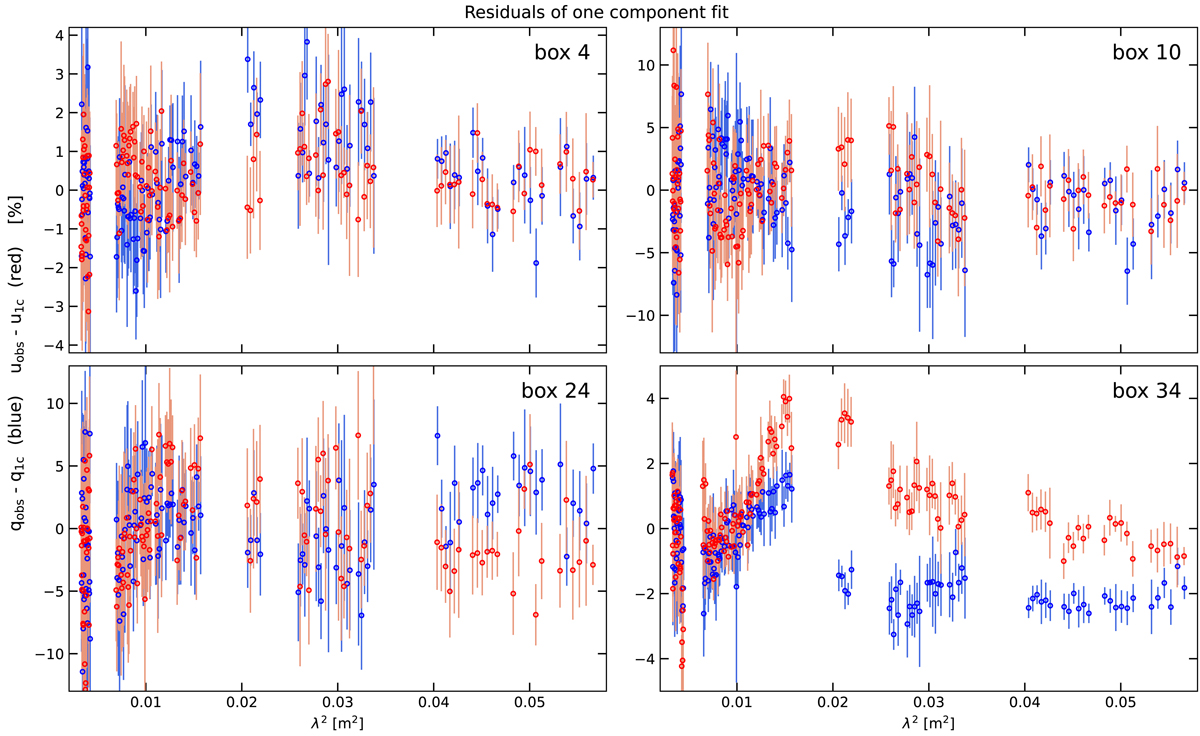
Fig. 9.
Download original image
Residual QU-spectra for the boxes 4, 10, 24, and 34 obtained after subtracting the best one component fit. The blue and red circles show the observed fractional q minus the best one component fit (q1c) and the observed fractional u minus the best one component fit (u1c), respectively. The systematic differences between the QU-spectra measured in the boxes and the fits are evident.
Current usage metrics show cumulative count of Article Views (full-text article views including HTML views, PDF and ePub downloads, according to the available data) and Abstracts Views on Vision4Press platform.
Data correspond to usage on the plateform after 2015. The current usage metrics is available 48-96 hours after online publication and is updated daily on week days.
Initial download of the metrics may take a while.