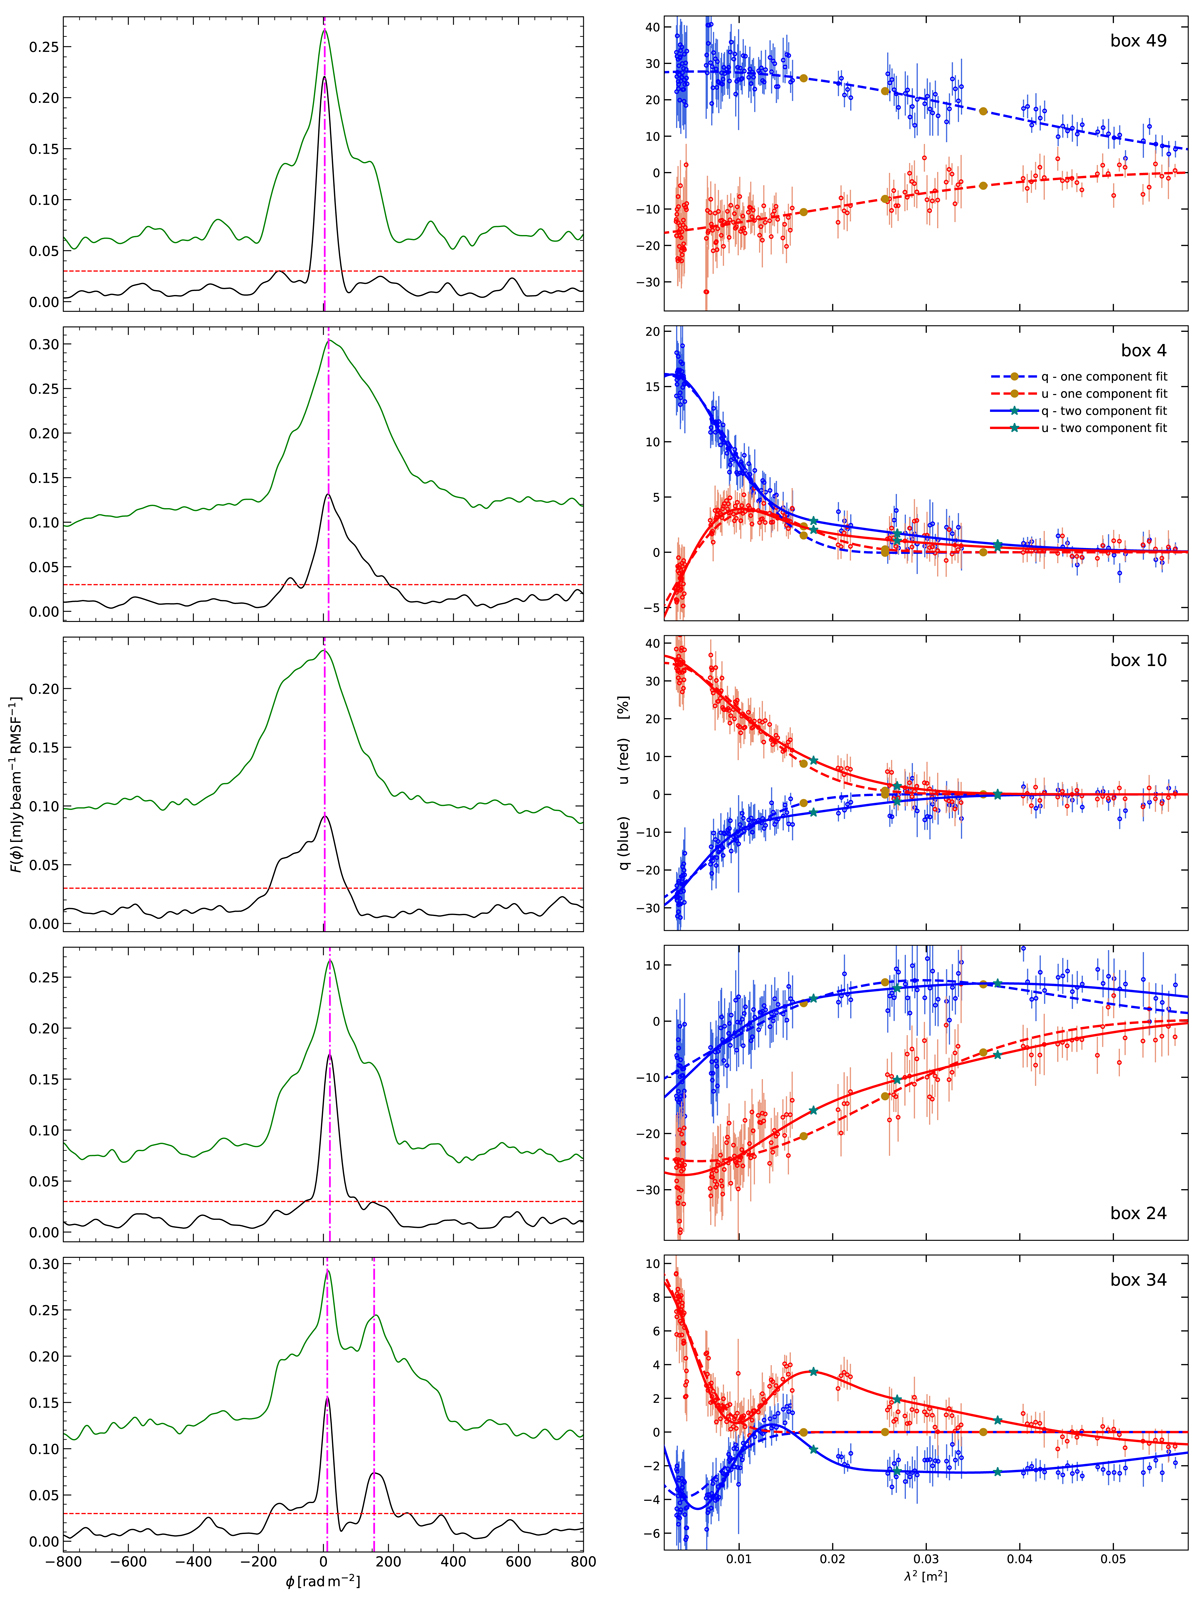
Fig. 8.
Download original image
Comparison between RM-synthesis and QU-fitting for boxes 49, 4, 10, 24, and 34. Left: cleaned (black) and dirty (green) Faraday dispersion functions (FDF) obtained using RM-synthesis. The red dashed line is drawn at the 8σQU level. The magenta lines indicate the peak positions (ϕmax) of the FDFs. Right: corresponding QU-fitting spectra, the fractional Stokes q (blue) and q (red) with the dots showing the QU-spectra measured in the boxes and the dashed and solid lines are the one and two component fits, respectively. We also mark the one and two component fits with brown circles and dark blue asterisks to clearly indicate the significance of these markers used in subsequent images. For boxes 4, 10, 24, and 34, the QU-spectra are better fitted with two components. Correspondingly, RM-synthesis shows broader FDF for these boxes. For simple regions, the example box 49 is shown. We find that both RM-synthesis and QU-fitting appears to be consistent with a single Faraday component.
Current usage metrics show cumulative count of Article Views (full-text article views including HTML views, PDF and ePub downloads, according to the available data) and Abstracts Views on Vision4Press platform.
Data correspond to usage on the plateform after 2015. The current usage metrics is available 48-96 hours after online publication and is updated daily on week days.
Initial download of the metrics may take a while.