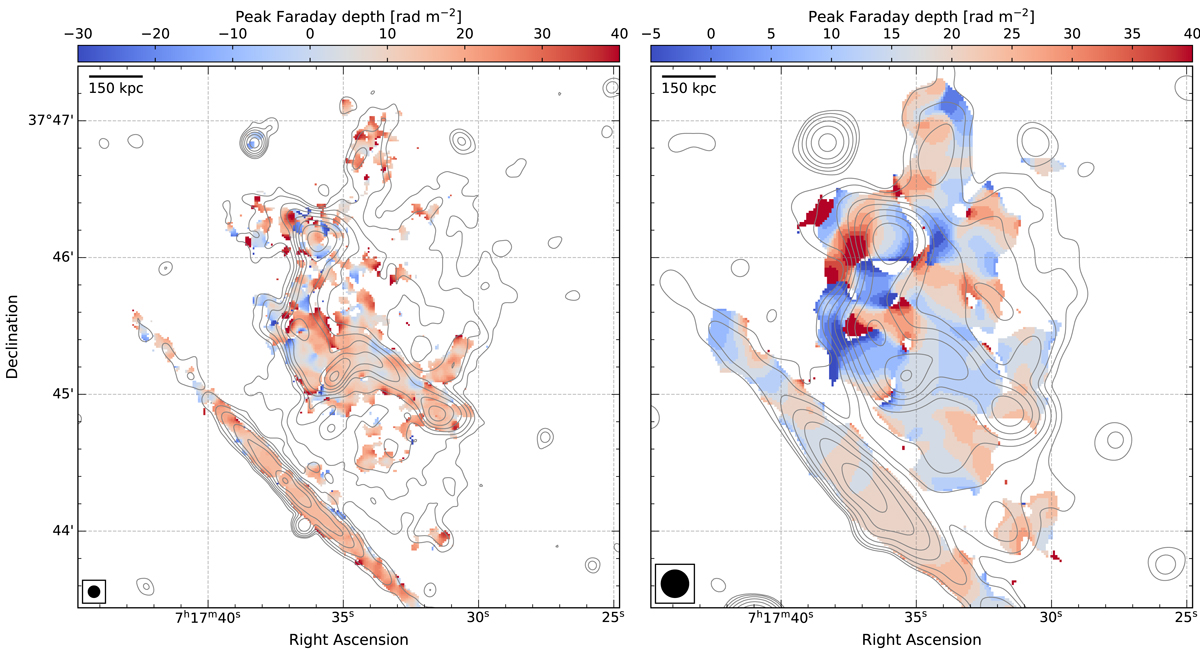
Fig. 7.
Download original image
Faraday depth (ϕmax) maps of the relic in MACS J0717.5+3745 measured over 1.0–6.5 GHz using RM-synthesis technique. Left: high-resolution (4″) Faraday map. The ϕmax distribution across the relic, in particular in the northern part is patchy with coherence lengths of 10–50 kpc. Right: low-resolution (12.5″) Faraday depth map. The measured ϕmax values in the polarized halo region are similar to the R3 region of the relic, indicating very little Faraday rotation intervening material. This suggests that these regions are located on the near side of the cluster.
Current usage metrics show cumulative count of Article Views (full-text article views including HTML views, PDF and ePub downloads, according to the available data) and Abstracts Views on Vision4Press platform.
Data correspond to usage on the plateform after 2015. The current usage metrics is available 48-96 hours after online publication and is updated daily on week days.
Initial download of the metrics may take a while.