Fig. 5.
Download original image
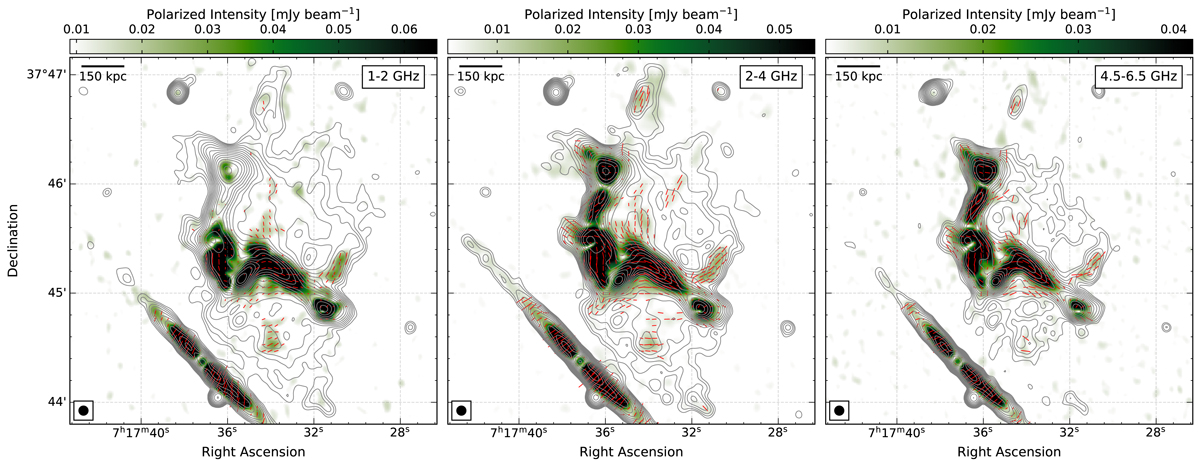
Polarization intensity maps (5″ resolution) at VLA L-, S-, and C-band after performing RM-synthesis. Red lines represent the magnetic field vectors. Their orientation represents the projected B-field corrected for Faraday rotation and contribution from the Galactic foreground. The vector lengths are proportional to the polarization percentage and their lengths are corrected for Ricean bias. No vectors were drawn for pixels below 5σ in the polarized intensity image. The distinct filaments, namely F1 and F2 (for labeling see Fig. 1), and some regions embedded in the halo emission are polarized between 10–38% between 1 and 6.5 GHz. At all the observed frequencies, the B-field across the relic and other features is highly-ordered. Contour levels are drawn at ![]() and are from the VLA L-band, S-band, and C-band Stokes I images at 1.5 GHz, 3 GHz, and 5.5 GHz, respectively. The image properties are given in Table 1, IM2, IM6, and IM10. The beam sizes are indicated in the bottom left corner of the each image.
and are from the VLA L-band, S-band, and C-band Stokes I images at 1.5 GHz, 3 GHz, and 5.5 GHz, respectively. The image properties are given in Table 1, IM2, IM6, and IM10. The beam sizes are indicated in the bottom left corner of the each image.
Current usage metrics show cumulative count of Article Views (full-text article views including HTML views, PDF and ePub downloads, according to the available data) and Abstracts Views on Vision4Press platform.
Data correspond to usage on the plateform after 2015. The current usage metrics is available 48-96 hours after online publication and is updated daily on week days.
Initial download of the metrics may take a while.