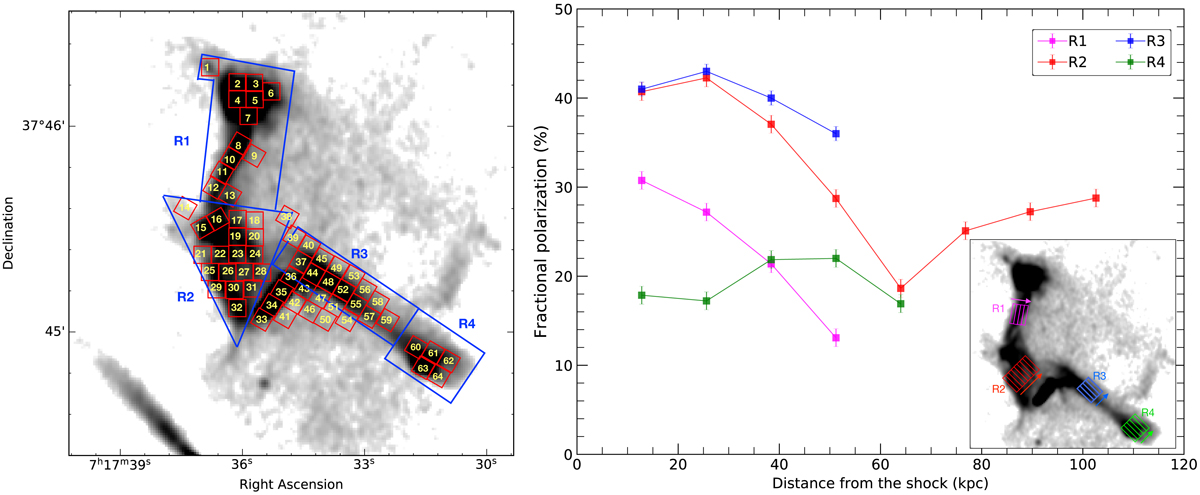
Fig. 4.
Download original image
Left: VLA L-band image depicting regions used for flux density extraction and RM-synthesis and QU-fitting. Blue regions show the relic subregions where the average fractional polarization was extracted. The fractional polarization at R3 in Table 2 is obtained by excluding the contribution from the NAT. Red boxes where flux densities and Faraday dispersion functions were extracted for QU-fitting and RM-synthesis, respectively. Each red box has a width of 5″, corresponding to a physical size of 32 kpc. Right: fractional polarization profiles across the relic extracted from the rectangular regions, depicted in the inset, of width 2″. There is a hint that the fractional polarization decreases in the downstream regions (i.e., shown with arrows).
Current usage metrics show cumulative count of Article Views (full-text article views including HTML views, PDF and ePub downloads, according to the available data) and Abstracts Views on Vision4Press platform.
Data correspond to usage on the plateform after 2015. The current usage metrics is available 48-96 hours after online publication and is updated daily on week days.
Initial download of the metrics may take a while.