Fig. 2.
Download original image
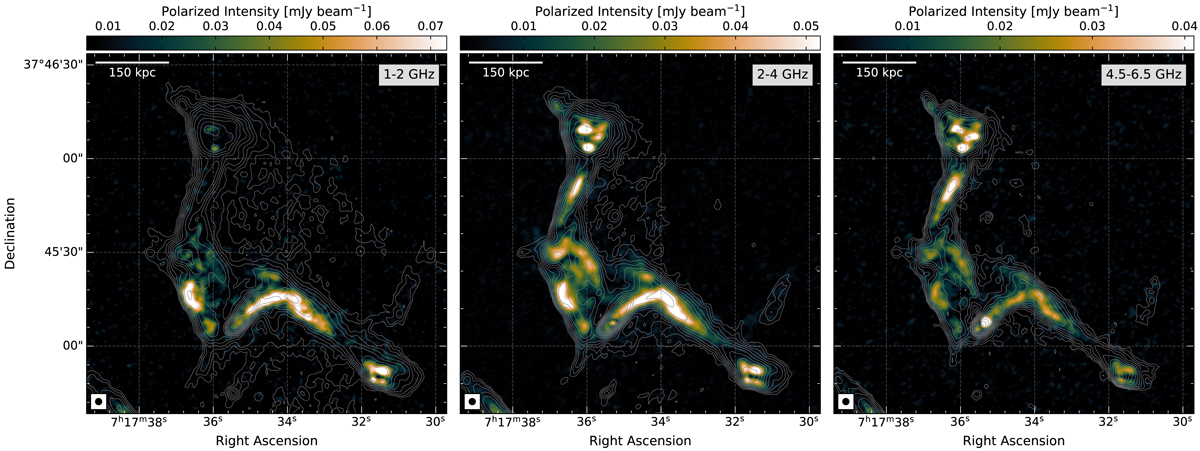
Polarization intensity images of the relic in MACS J0717.5+3745 at 2″ resolution, showing that the polarization emission is distributed in a clumpy manner. The image also revels fine, small-scale filaments visible in the total power emission. Contour levels are drawn at ![]() and are from the VLA L-, S-, and C-band Stokes I images. The beam sizes are indicated in the bottom left corner of the each image. The image properties are given in Table 1, IM1, IM5, and IM9.
and are from the VLA L-, S-, and C-band Stokes I images. The beam sizes are indicated in the bottom left corner of the each image. The image properties are given in Table 1, IM1, IM5, and IM9.
Current usage metrics show cumulative count of Article Views (full-text article views including HTML views, PDF and ePub downloads, according to the available data) and Abstracts Views on Vision4Press platform.
Data correspond to usage on the plateform after 2015. The current usage metrics is available 48-96 hours after online publication and is updated daily on week days.
Initial download of the metrics may take a while.