Fig. 18.
Download original image
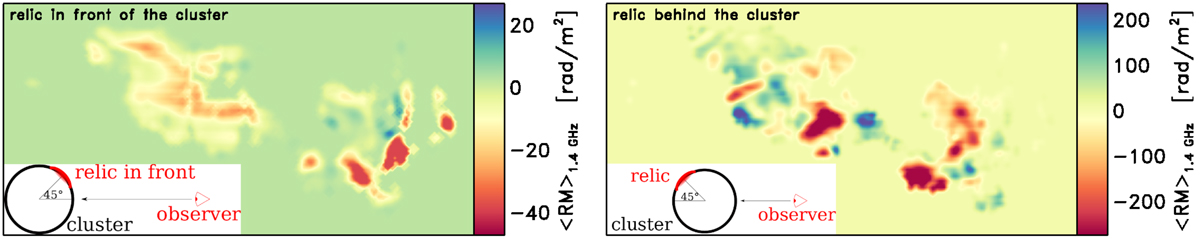
Simulations presented as maps of the average RM, radio weighted at 1.4 GHz. Left: RM distribution if the relic lies in front of the cluster, as depicted in the inset. Right: RM distribution if the relic lies behind the cluster, as show in the inset. These maps show that strong fluctuations in the RM are expected if the relic is located within, or behind, the ICM screen.
Current usage metrics show cumulative count of Article Views (full-text article views including HTML views, PDF and ePub downloads, according to the available data) and Abstracts Views on Vision4Press platform.
Data correspond to usage on the plateform after 2015. The current usage metrics is available 48-96 hours after online publication and is updated daily on week days.
Initial download of the metrics may take a while.