Fig. 15.
Download original image
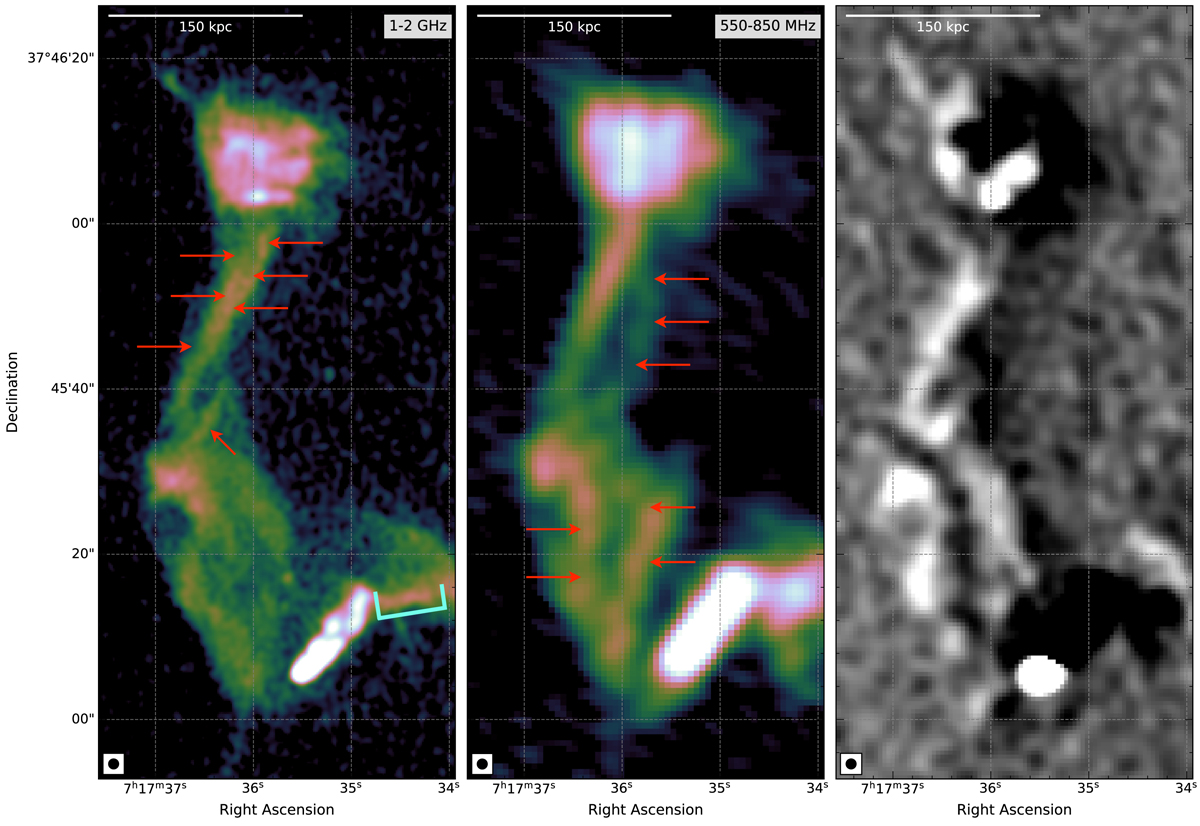
High-resolution VLA (left panel; van Weeren et al. 2017b) and uGMRT (middle panel; Rajpurohit et al. 2020a) images of the northern part of the relic. The red arrows show regions with fine filaments. The spectral tomography map of the same region is shown in the right panel, indicating that the relic is indeed composed of filaments with different spectral indices (Rajpurohit et al. 2021c). For the majority of these regions, the QU-fitting provides a better fit with two Faraday components.
Current usage metrics show cumulative count of Article Views (full-text article views including HTML views, PDF and ePub downloads, according to the available data) and Abstracts Views on Vision4Press platform.
Data correspond to usage on the plateform after 2015. The current usage metrics is available 48-96 hours after online publication and is updated daily on week days.
Initial download of the metrics may take a while.