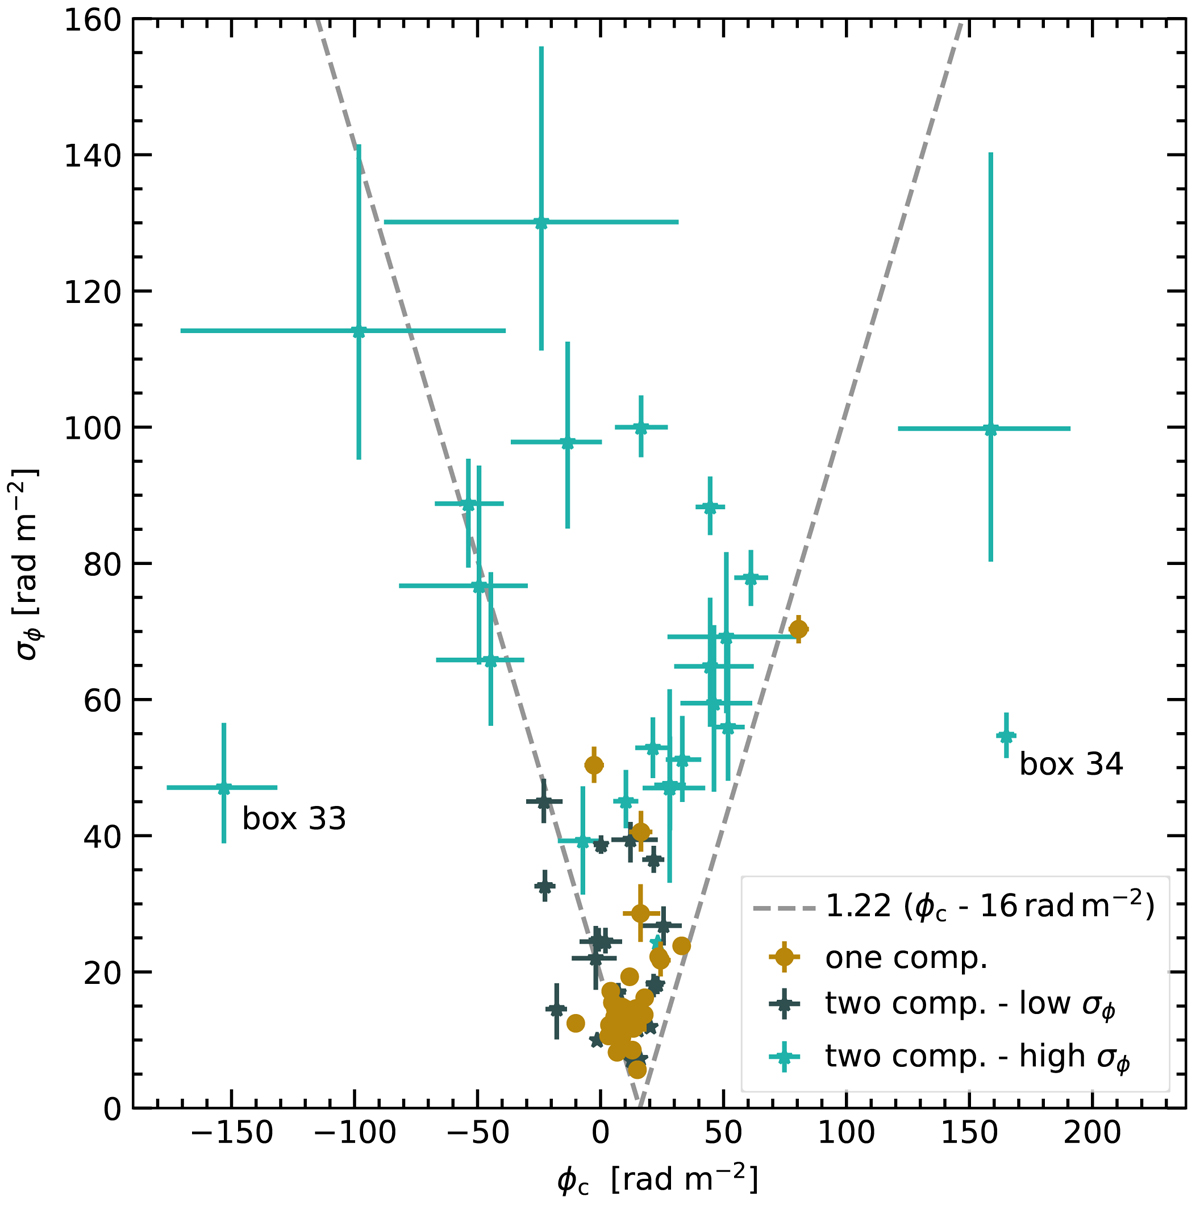
Fig. 14.
Download original image
Central Faraday depth as a function of Faraday dispersion, measured in the observer’s frame. Dashed lines indicate σϕ = 1.22(ϕc − 16 rad m−2), where 16 rad m−2 is the Faraday depth due to the Galactic foreground. One component models are indicated with brown filled circles and two component models with black and cyan stars, where black indicates the component with the lower Faraday dispersion and cyan the higher one. Components shown in Fig. 10 with a very large uncertainties are neglected here because they do not provide any constraint. The plot shows that the scatter of the central Faraday depth increases with increasing Faraday dispersion.
Current usage metrics show cumulative count of Article Views (full-text article views including HTML views, PDF and ePub downloads, according to the available data) and Abstracts Views on Vision4Press platform.
Data correspond to usage on the plateform after 2015. The current usage metrics is available 48-96 hours after online publication and is updated daily on week days.
Initial download of the metrics may take a while.