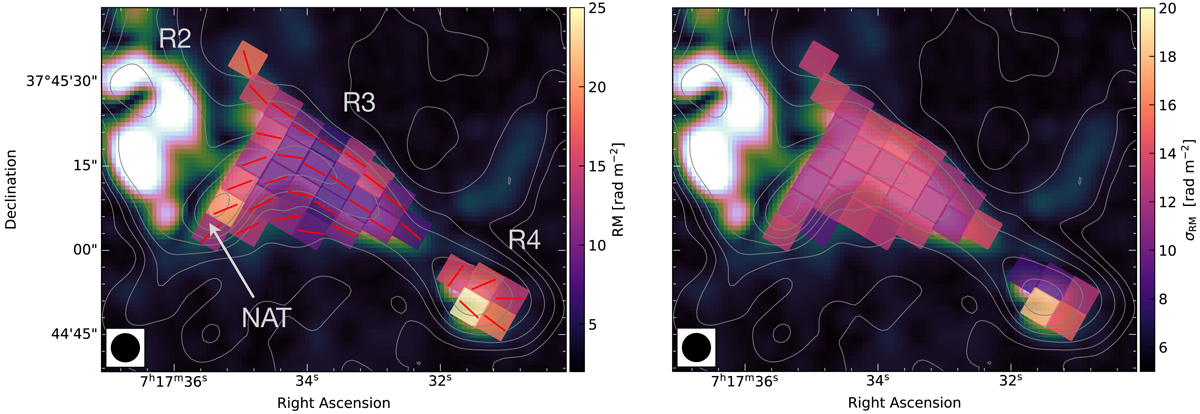
Fig. 12.
Download original image
ϕc and σϕ values across the R3 and R4 region of the relic obtained with QU-fitting. For almost all boxes the one Gaussian component model is preferred, except for the region where the NAT galaxy is located. We note that for the NAT region only the low dispersion component is shown in the figure, matching the ϕc of the relic. Moreover, the left panel (red lines) shows the intrinsic polarization angle. The QU-fitting results are overlaid on the polarization intensity at 5″ and contours of the VLA L-band Stokes I image; see Table 1, IM6 for the image properties. Contour levels are drawn at [1, 2, 4, 8, …] × 5 σrms. From these maps, it is evident that ϕc and σϕ are low in this region of the relic, particularly in the R3 region and not changing significantly from box to box. The central Faraday depth of the Gaussian components are very close to the Galactic foreground RM, indicating very little Faraday rotation due material intervening the line of sight to cluster outside of the Milky Way. This suggests that this part of the relic is located at the periphery of the cluster towards the observer.
Current usage metrics show cumulative count of Article Views (full-text article views including HTML views, PDF and ePub downloads, according to the available data) and Abstracts Views on Vision4Press platform.
Data correspond to usage on the plateform after 2015. The current usage metrics is available 48-96 hours after online publication and is updated daily on week days.
Initial download of the metrics may take a while.