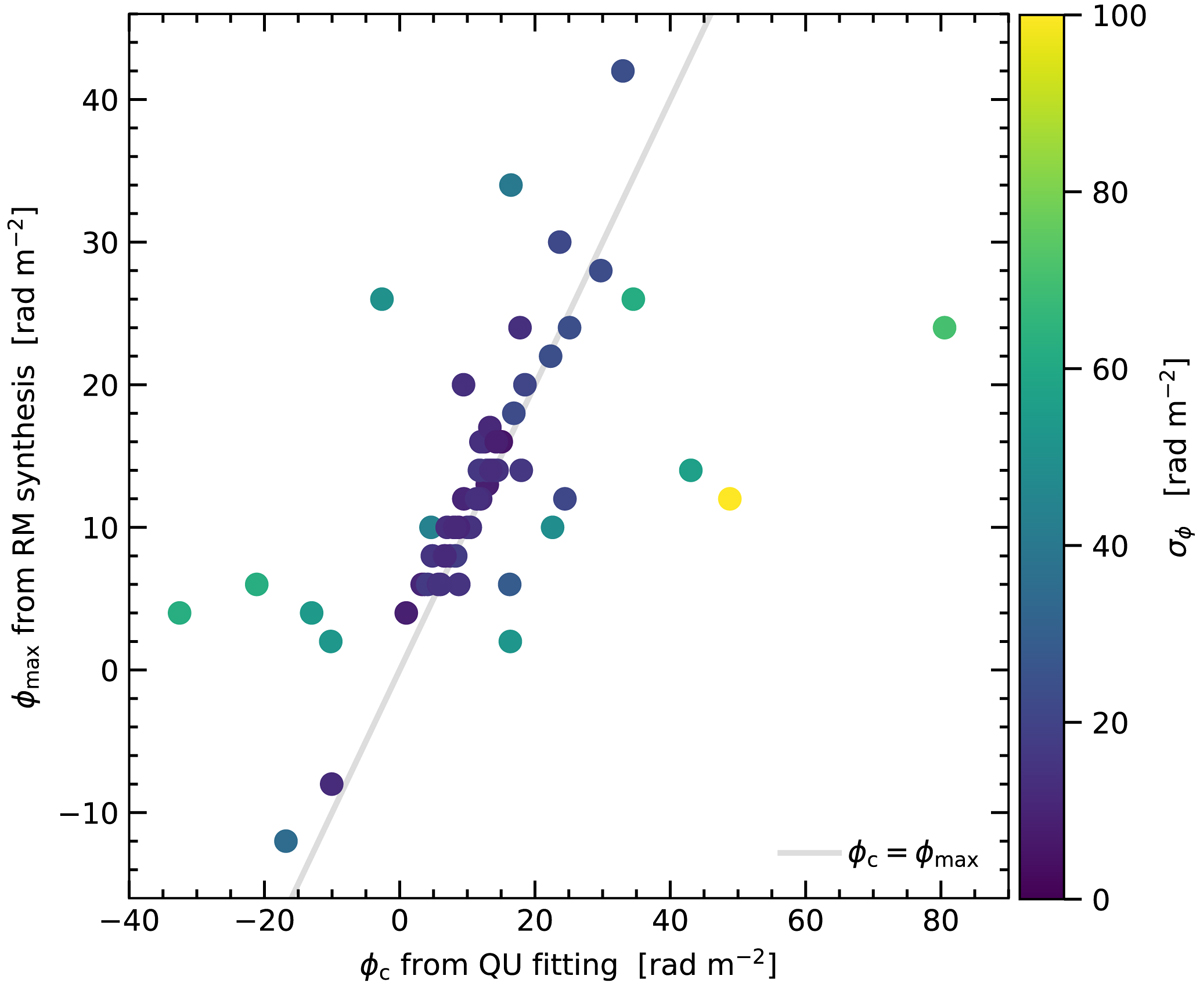
Fig. 11.
Download original image
Central Faraday depth, ϕc, position of the single component from QU-fitting (see Fig. 10 brown markers. We note that here we use the one-component fit for all boxes) versus peak position, ϕmax in the RM-synthesis spectra. The color indicates the Faraday depth width of the QU-fitting component. Evidently, QU-fitting and RM-synthesis gives similar results in case of a low Faraday dispersion. Larger differences between QU-fitting and RM-synthesis correspond to higher Faraday dispersions.
Current usage metrics show cumulative count of Article Views (full-text article views including HTML views, PDF and ePub downloads, according to the available data) and Abstracts Views on Vision4Press platform.
Data correspond to usage on the plateform after 2015. The current usage metrics is available 48-96 hours after online publication and is updated daily on week days.
Initial download of the metrics may take a while.