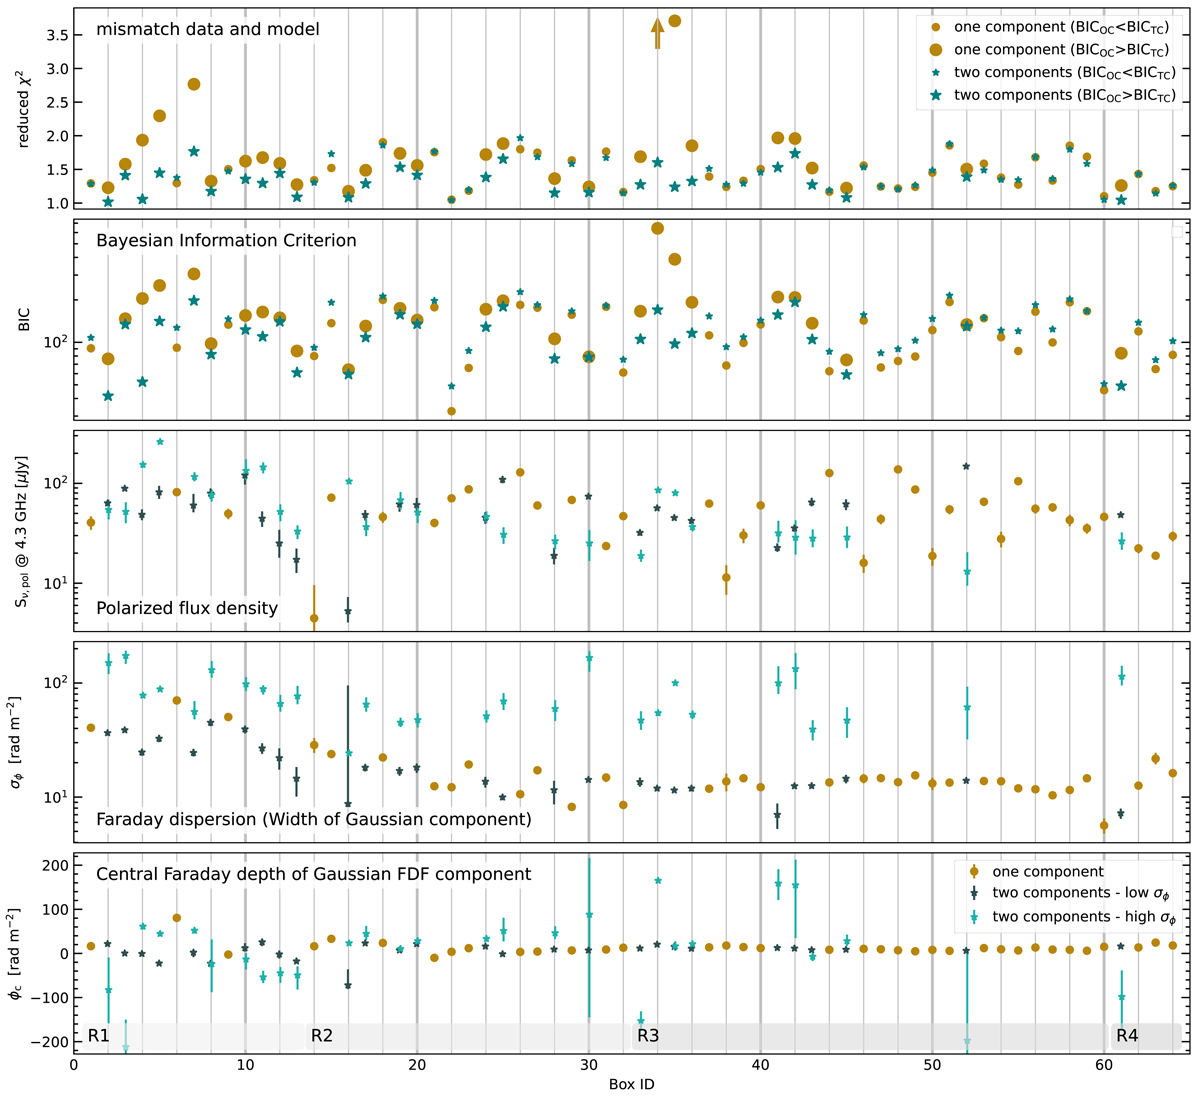
Fig. 10.
Download original image
Results from QU-fitting. The best-fit parameters obtained by fitting a single and two independent one-component models are shown. The one component model fits are indicated with brown filled circles and the two component models with dark blue and cyan asterisks. The resulting reduced χ2 for each box is shown in the top panel and the BIC in the second one. If the BIC of the two component fit lower than the one component fit, the former is adopted for further analysis. For theses boxes the best fit parameters are shown with cyan and dark blue asterisks where the cyan color is assigned to the component with the higher Faraday dispersion. The third, fourth, and fifth panels show the intrinsic polarized luminosity, Sν, pol, the Faraday dispersion, and the position for each of the Gaussian components. Finally, the Boxes used for extracting the Stokes IQU values are shown Fig 4. The plot shows that many regions in R1 and R2 are fitted better using two components.
Current usage metrics show cumulative count of Article Views (full-text article views including HTML views, PDF and ePub downloads, according to the available data) and Abstracts Views on Vision4Press platform.
Data correspond to usage on the plateform after 2015. The current usage metrics is available 48-96 hours after online publication and is updated daily on week days.
Initial download of the metrics may take a while.