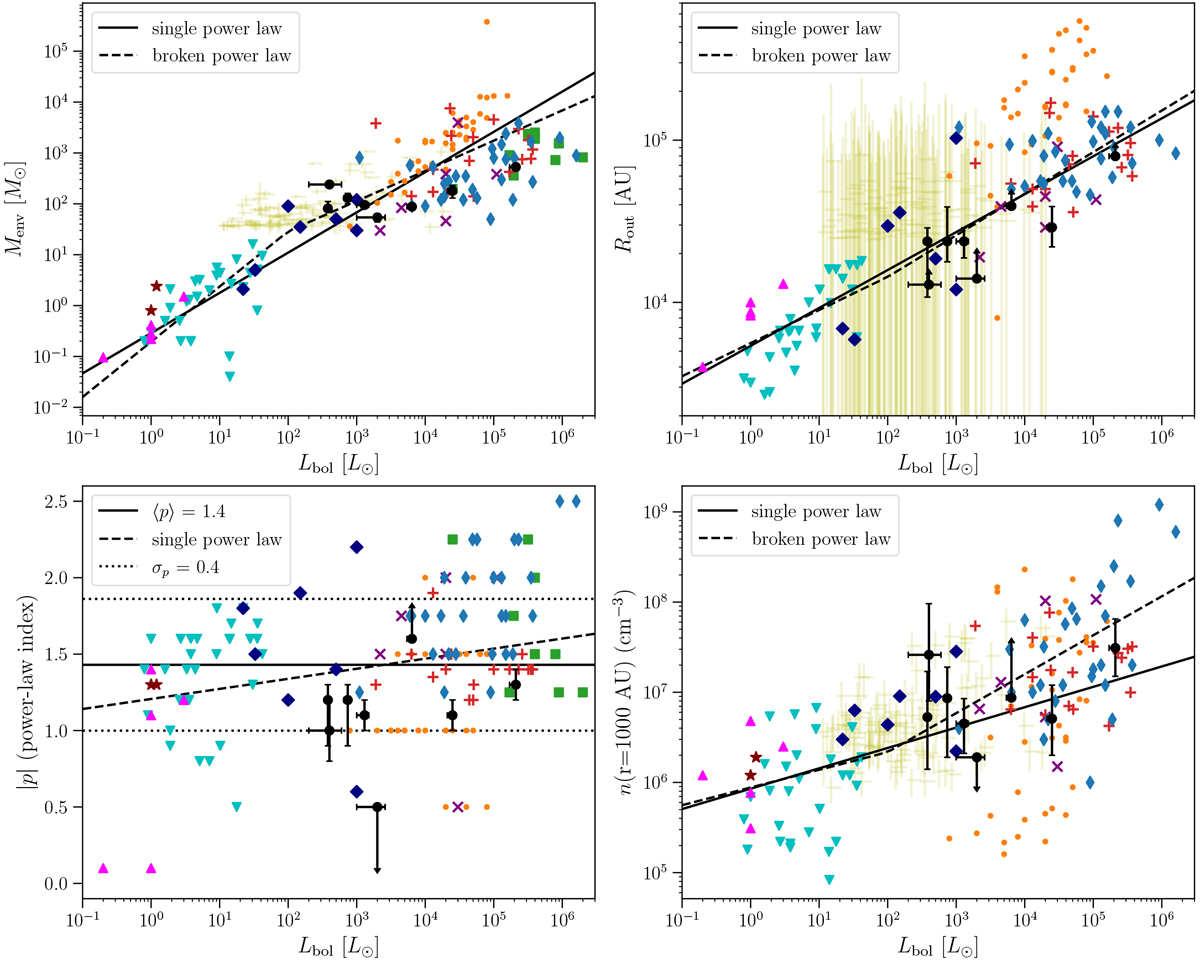
Fig. 6
Download original image
Comparison of PILS-Cygnus Sources (large black circles with error bars) to objects in the literature from van der Tak et al. (2000) (purple x’s), Jørgensen et al. (2002) (magenta upward-pointing triangles), Mueller et al. (2002) (thin blue diamonds), Shirley et al. (2002) (maroon stars), Hatchell & van der Tak (2003) (green squares), Williams et al. (2005) (small orange circles), Crimier et al. (2009, 2010a,b) (wide navy diamonds), Kristensen et al. (2012) (cyan downward-pointing triangles), van der Tak et al. (2013) (red plus signs), and Cao et al. (2019) (pale gold error bars). Solid and dashed black lines represent single and broken power law fits to the data, respectively.
Current usage metrics show cumulative count of Article Views (full-text article views including HTML views, PDF and ePub downloads, according to the available data) and Abstracts Views on Vision4Press platform.
Data correspond to usage on the plateform after 2015. The current usage metrics is available 48-96 hours after online publication and is updated daily on week days.
Initial download of the metrics may take a while.