Fig. 4
Download original image
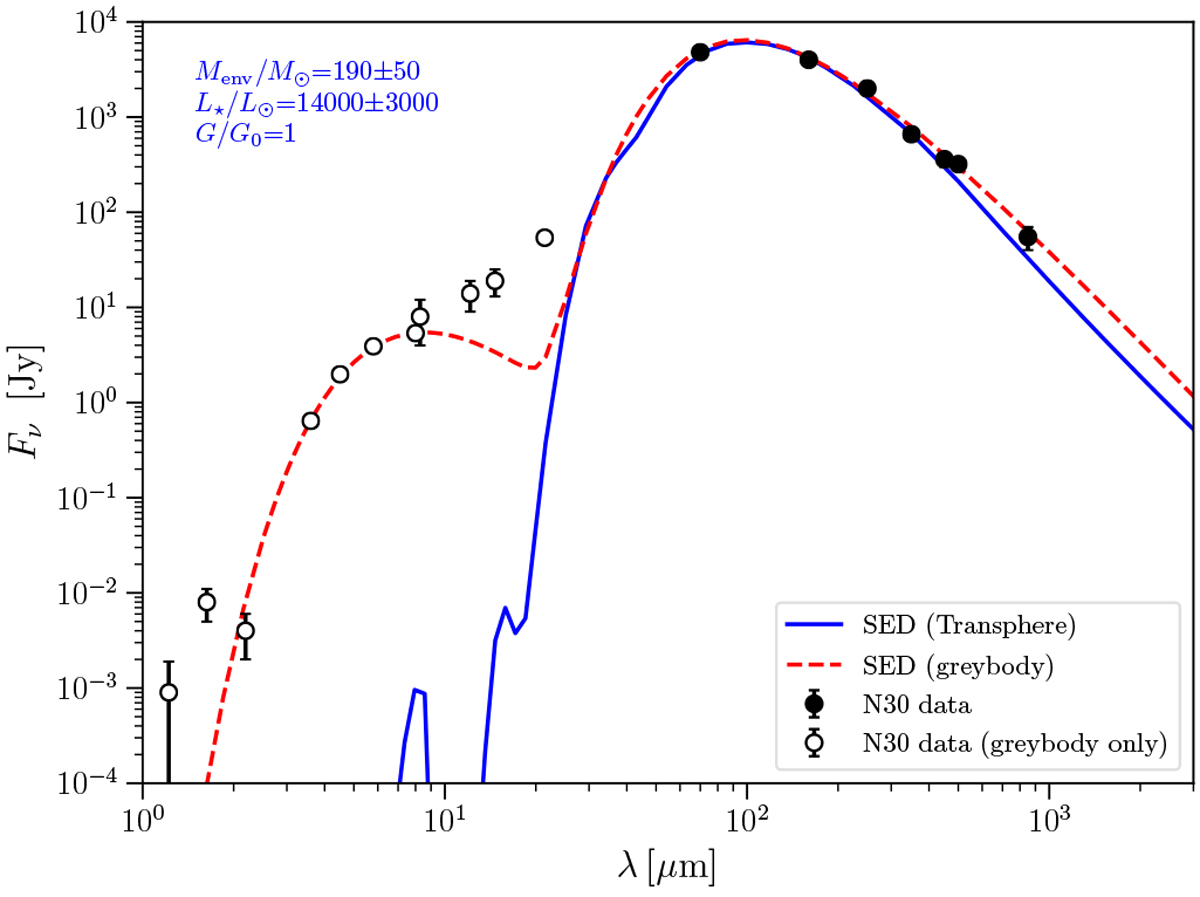
SEDs of N30. The dashed red line is the modified greybody fit to the data, shown as black and grey markers with error bars. The solid blue line is the best fit Transphere SED to only the data shown in black. The grey points at λ < 70 μm were excluded from the fit because the SED at these wavelengths likely traces a warm inner disk where the assumption of spherical symmetry breaks down.
Current usage metrics show cumulative count of Article Views (full-text article views including HTML views, PDF and ePub downloads, according to the available data) and Abstracts Views on Vision4Press platform.
Data correspond to usage on the plateform after 2015. The current usage metrics is available 48-96 hours after online publication and is updated daily on week days.
Initial download of the metrics may take a while.