Fig. 3
Download original image
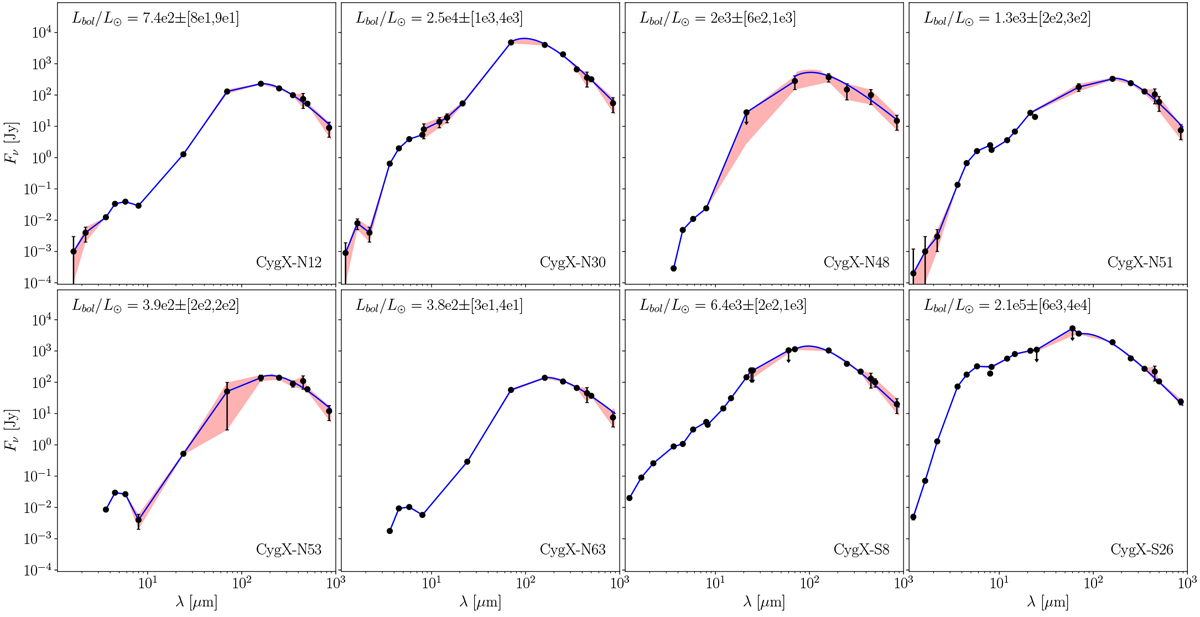
Full SEDs for all sources, which were fitted, interpolated, and integrated by trapezoidal sums to calculate the bolometric luminosities. The curves running through data at λ ≥ 70 μm are the FIR/submm component of the SED fits discussed in Sect. 2.3, while the rest of the data has been log-linearly interpolated in lieu of integrating over the less-physical warmer SED components. For N30 and N51, no SED components passed through the 70 μm data point, so the SED fit was only used for λ ≥ 160 μm while the 70 μm data were linearly interpolated like the shorter wavelength data. The light red filled curves show the margins of uncertainty as constrained by the flux errors, and were likewise integrated to estimate the total uncertainty in luminosity.
Current usage metrics show cumulative count of Article Views (full-text article views including HTML views, PDF and ePub downloads, according to the available data) and Abstracts Views on Vision4Press platform.
Data correspond to usage on the plateform after 2015. The current usage metrics is available 48-96 hours after online publication and is updated daily on week days.
Initial download of the metrics may take a while.