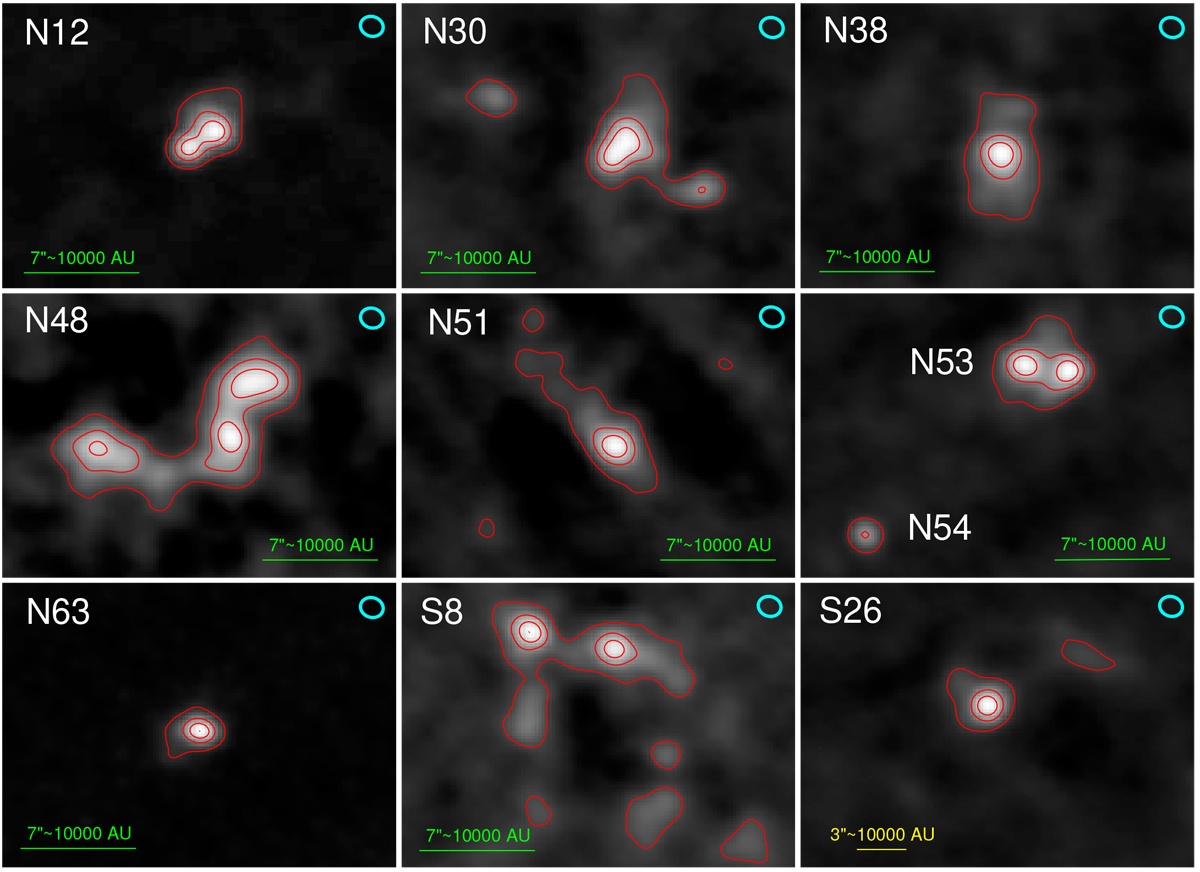
Fig. 1
Download original image
SMA 868 μm (345 GHz) images of all 10 PILS-Cygnus sources (N53 and N54 are both featured in the middle right panel) contoured in red at 10, 40, and 70% of the maximum flux. The cyan ellipses in the upper right corners show the FWHMa of both axes and positionangle of the synthesised SMA beam, and the line segments alone the bottoms of each panel show how long 10 000 AU and its corresponding angular length appears at the adopted distance to each object. We note the change of scale for S26. All images are normalised to their peak flux densities, which are given in Table 1.
Current usage metrics show cumulative count of Article Views (full-text article views including HTML views, PDF and ePub downloads, according to the available data) and Abstracts Views on Vision4Press platform.
Data correspond to usage on the plateform after 2015. The current usage metrics is available 48-96 hours after online publication and is updated daily on week days.
Initial download of the metrics may take a while.