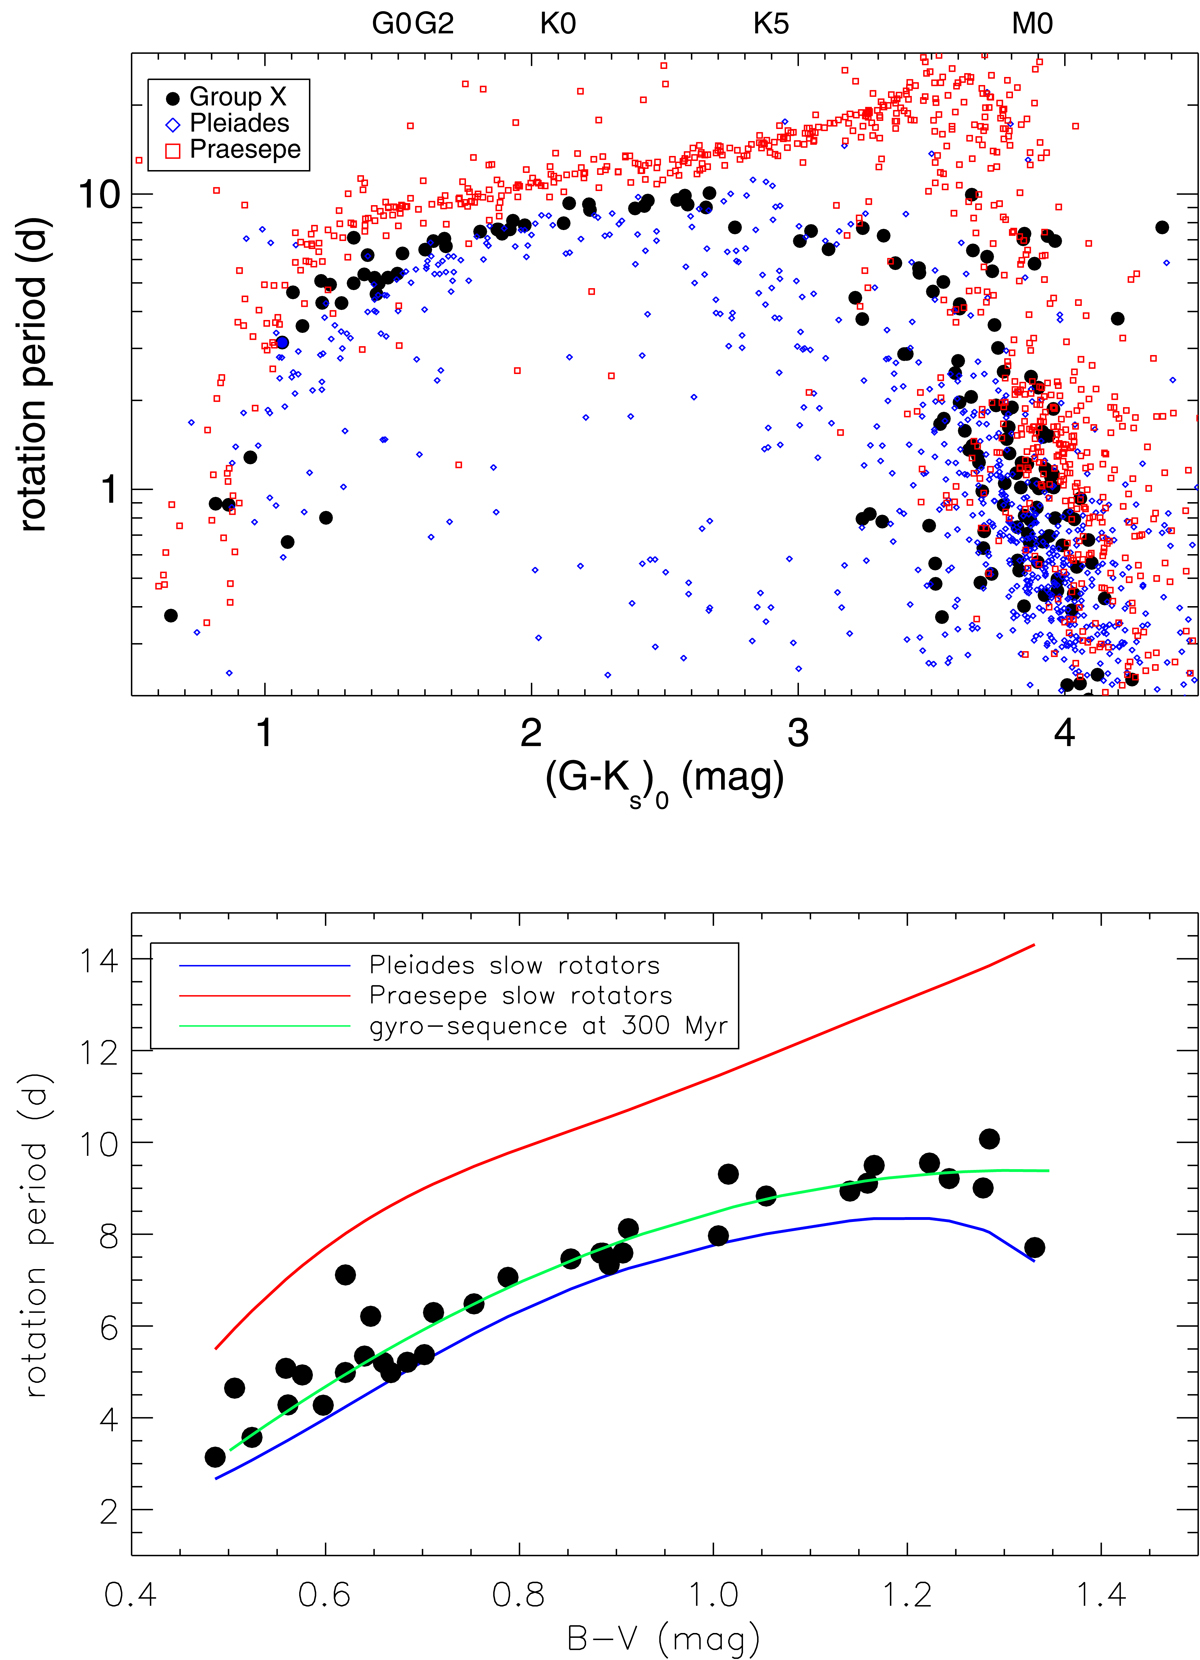
Fig. 4.
Download original image
Comparison of colour-period distribution of Group X with age-benchmark open clusters. Top panel: distribution of stellar rotation periods of Group X with the Pleiades and Praesepe distributions overplotted. Bottom panel: distribution of the rotation periods of slow rotators of Group X versus B − V colour, with the polynomial fits to median rotation periods of slow rotators in the Praesepe (red line) and Pleiades (blue line) clusters and, as an example, the gyro-sequence corresponding to an age of 300 Myr (green line), according to the Mamajek & Hillenbrand (2008) coefficients, overplotted.
Current usage metrics show cumulative count of Article Views (full-text article views including HTML views, PDF and ePub downloads, according to the available data) and Abstracts Views on Vision4Press platform.
Data correspond to usage on the plateform after 2015. The current usage metrics is available 48-96 hours after online publication and is updated daily on week days.
Initial download of the metrics may take a while.