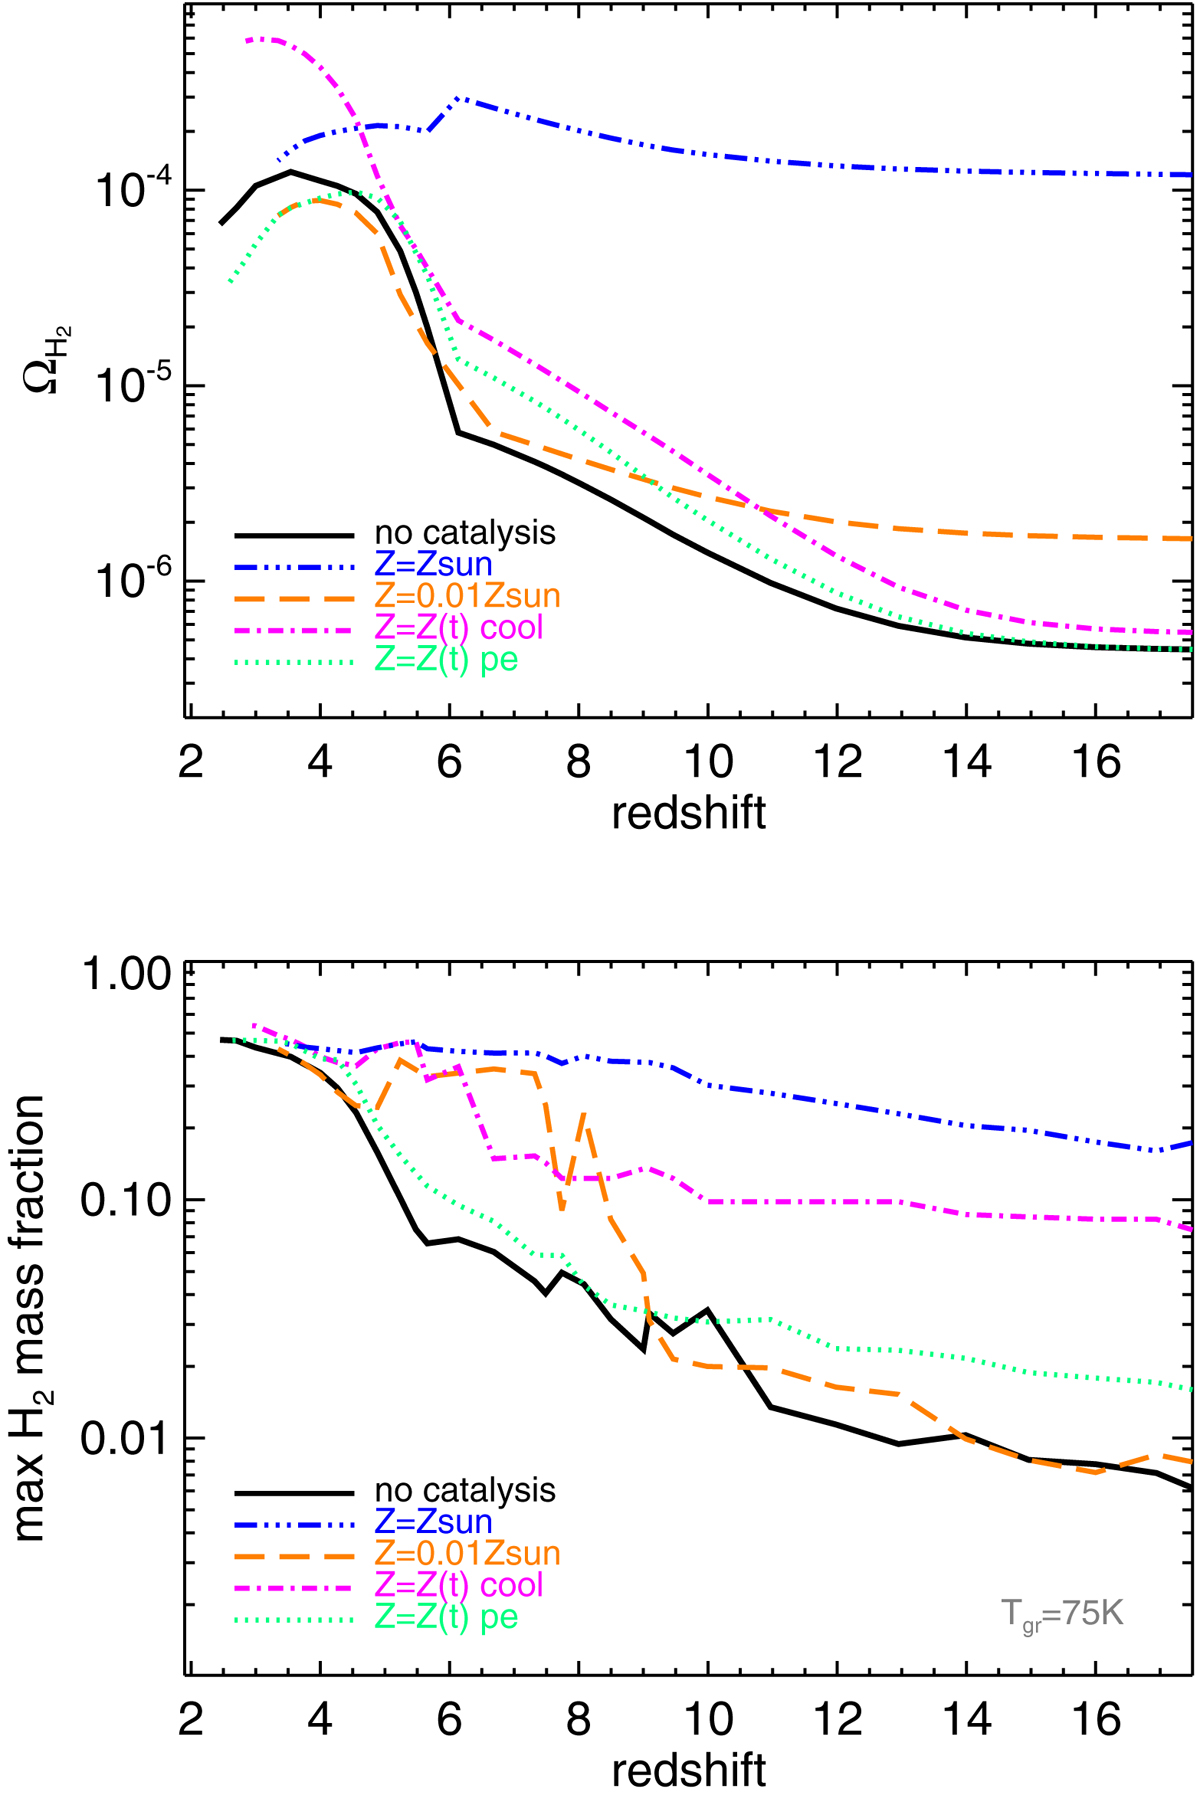
Fig. C.2.
Download original image
ΩH2 evolution (upper panel) and maximum H2 mass fractions (lower panel) reached in the no-catalysis simulation (black solid lines; HM-HISSmed) are compared to runs including H2 grain catalysis at Tgr = 75 K. Gas Z is either forced to constant values of Z = Z⊙ (blue dot-dot-dot-dashed lines; HM-HISS-cat-75-Zsun) and 0.01 Z⊙ (orange dashed lines; HM-HISS-cat-75-0.01Zsun), or consistently computed from temporal evolution of SN II, AGB, and SN Ia metal spreading and cooling from both resonant and fine-structure lines (magenta dot-dashed lines; HM-HISS-cat-75-Zt). Photoelectric heating on dust grains is tested, as well (green dotted lines; HM-HISSmed-cat-75-pe).
Current usage metrics show cumulative count of Article Views (full-text article views including HTML views, PDF and ePub downloads, according to the available data) and Abstracts Views on Vision4Press platform.
Data correspond to usage on the plateform after 2015. The current usage metrics is available 48-96 hours after online publication and is updated daily on week days.
Initial download of the metrics may take a while.