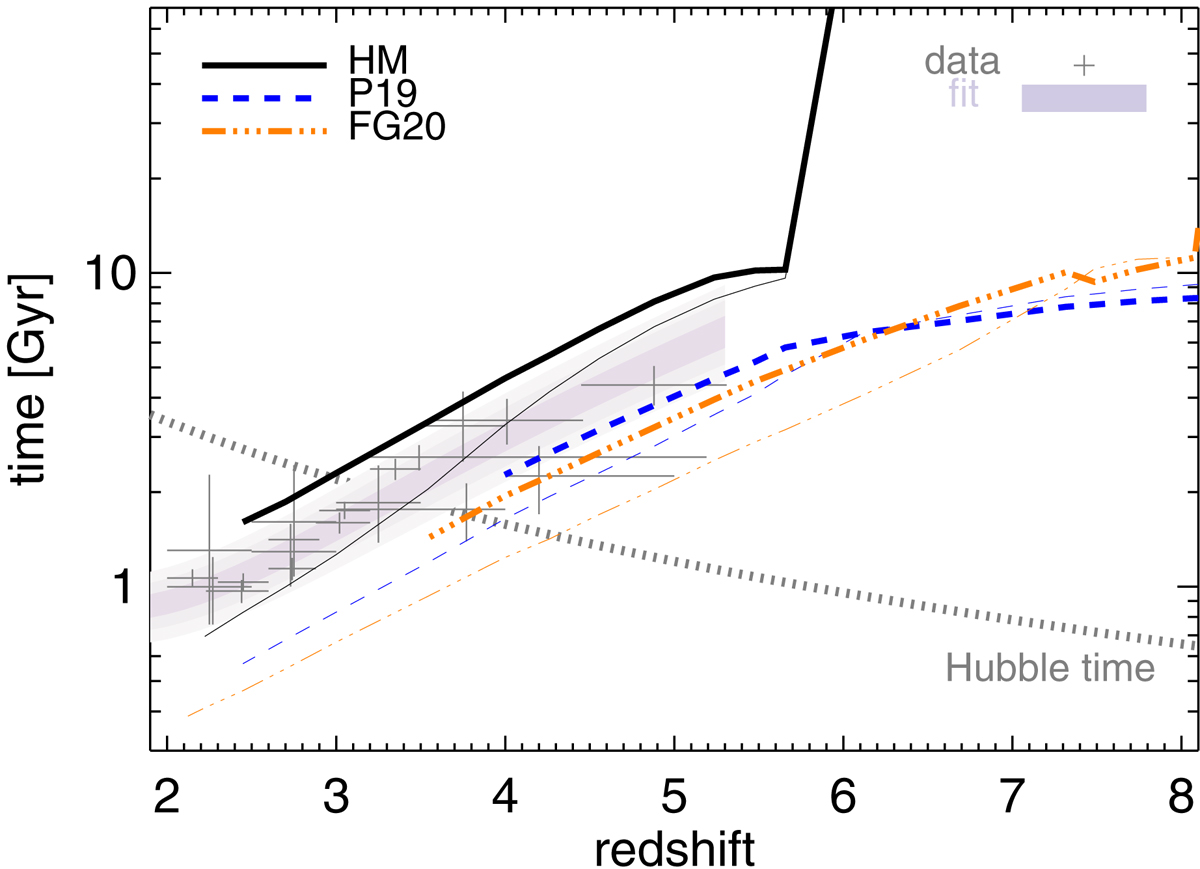
Fig. 5.
Download original image
Redshift evolution of the neutral-gas depletion times in simulations with HM, P19, and FG20 (solid, dashed and dot-dot-dot-dashed lines, respectively) UV backgrounds compared to depletion times with 1σ errors (grey points) derived from Ωneutral observational data and 1, 2, and 3σ confidence levels (from darker to lighter shades) (see also Fig. 3). Results are for HI shielded (thick) and HI unshielded (thin) scenarios. The Hubble time (grey dotted line) is also shown.
Current usage metrics show cumulative count of Article Views (full-text article views including HTML views, PDF and ePub downloads, according to the available data) and Abstracts Views on Vision4Press platform.
Data correspond to usage on the plateform after 2015. The current usage metrics is available 48-96 hours after online publication and is updated daily on week days.
Initial download of the metrics may take a while.