Fig. 4.
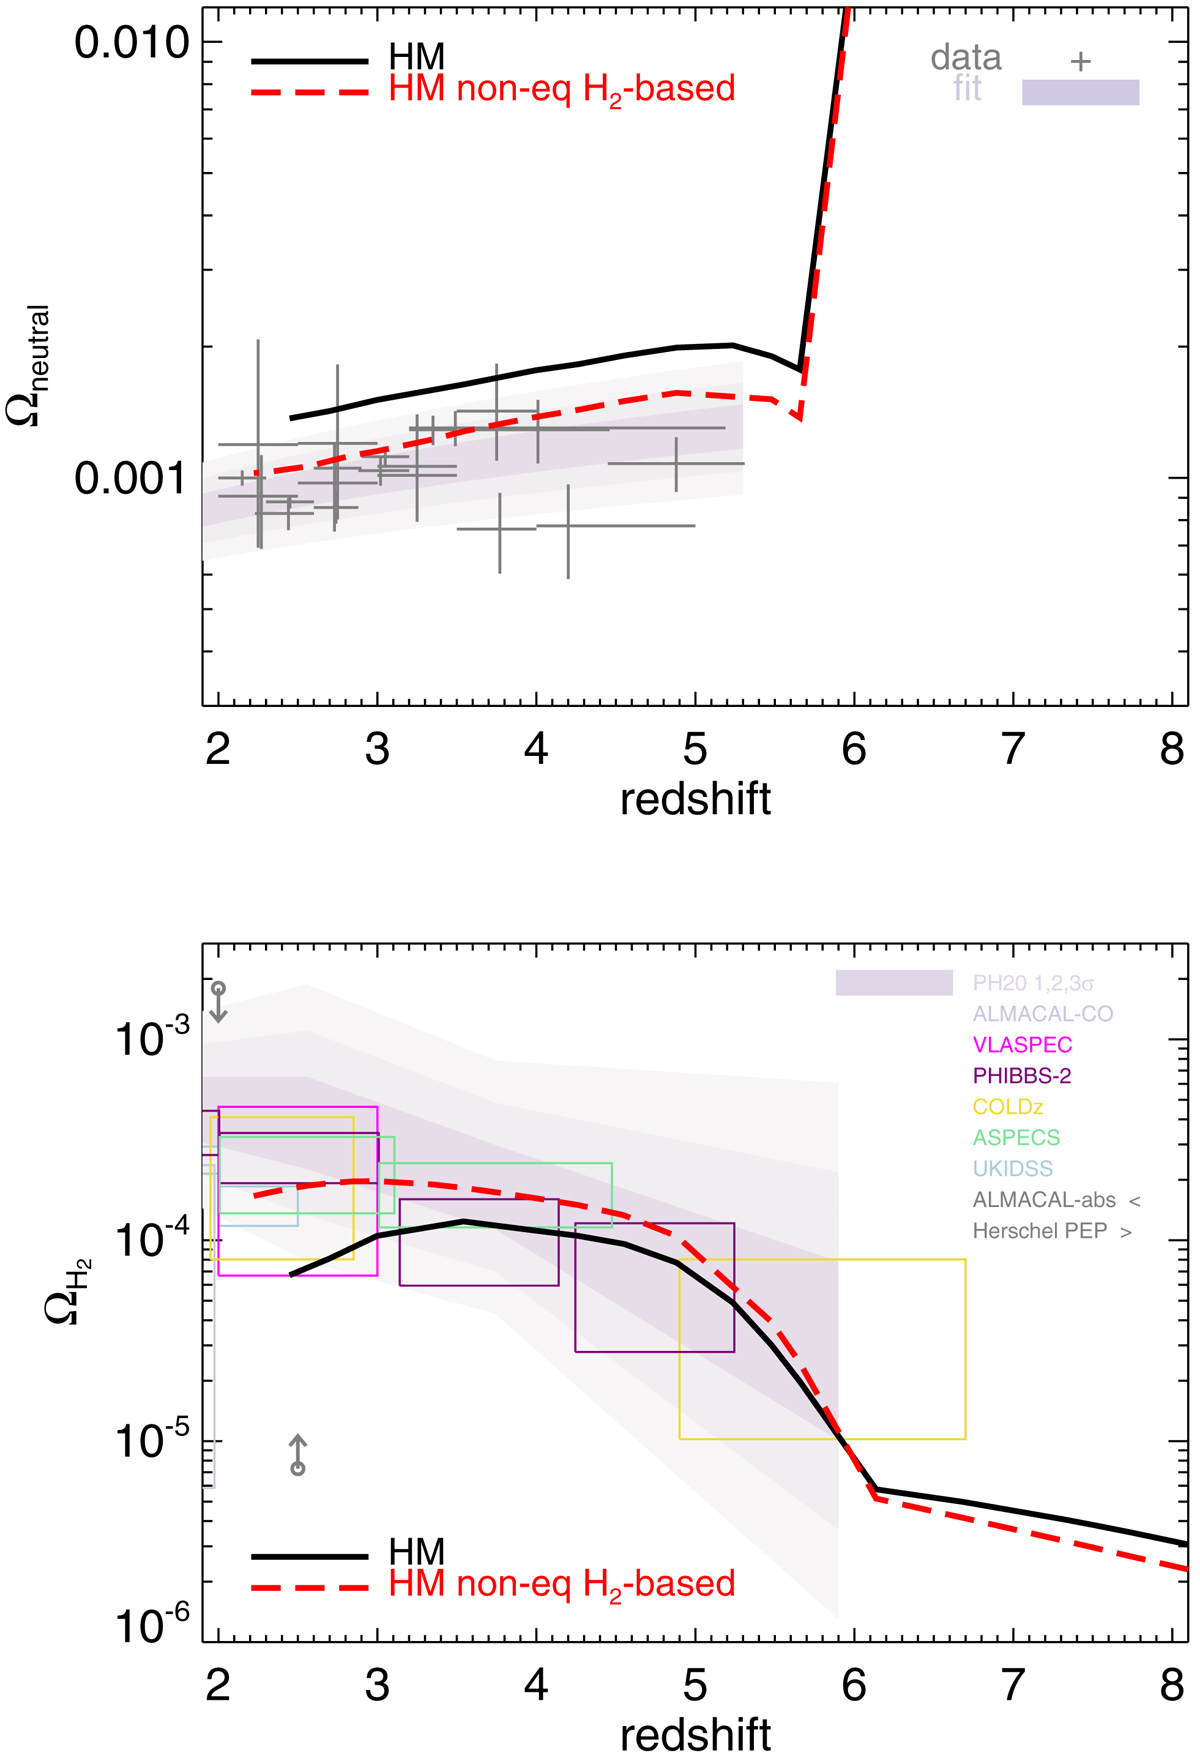
Download original image
Upper panel: Ωneutral evolution for the non-equilibrium H2-based star formation model (red dashed line, HM-HISSmed-H2) with an HM background and compared to the reference run (solid black line, HM-HISSmed). Lower panel: corresponding ΩH2 evolution. Observational determinations are listed in Table A.1 (see also text and Fig. 3).
Current usage metrics show cumulative count of Article Views (full-text article views including HTML views, PDF and ePub downloads, according to the available data) and Abstracts Views on Vision4Press platform.
Data correspond to usage on the plateform after 2015. The current usage metrics is available 48-96 hours after online publication and is updated daily on week days.
Initial download of the metrics may take a while.