Fig. 3.
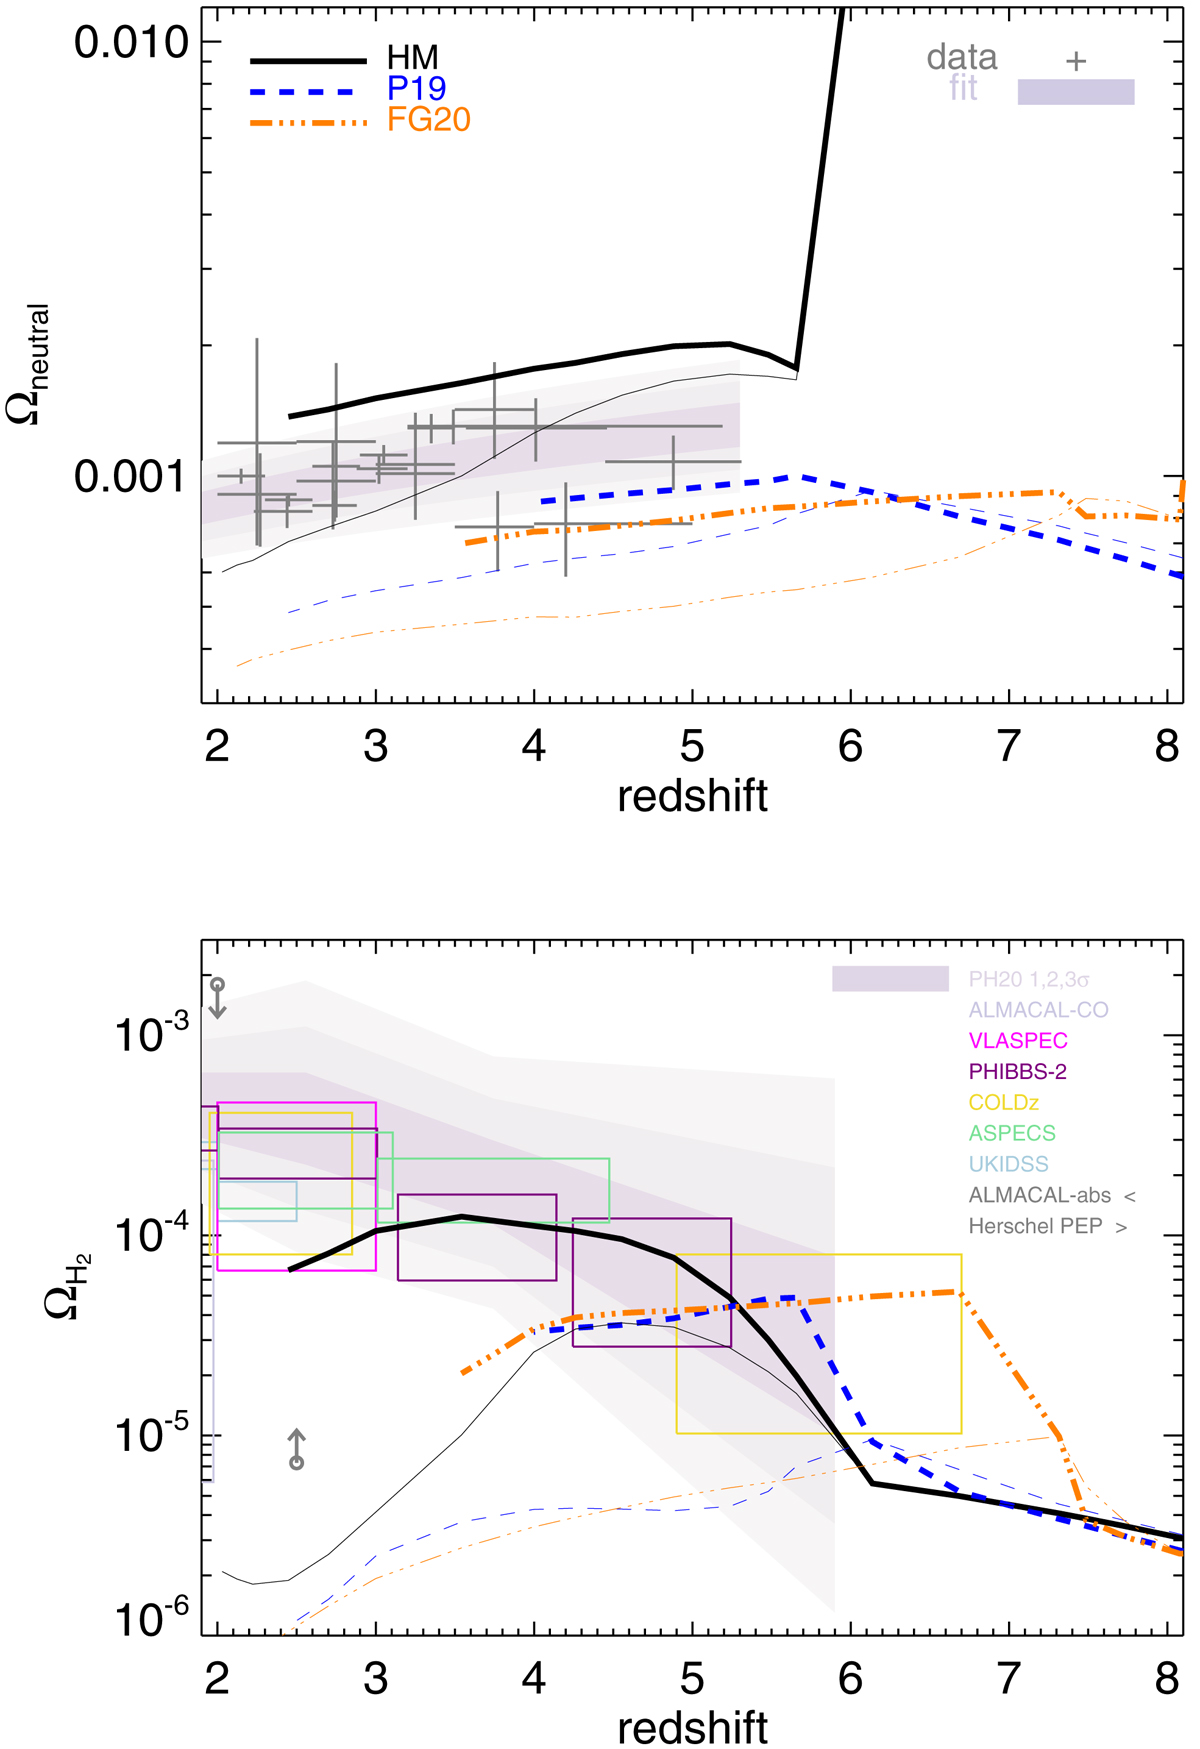
Download original image
Upper panel: redshift evolution of Ωneutral compared to inferred values from HI observations with 1σ error bars (grey points) and corresponding fit (from darker to lighter shades) at 1, 2, and 3σ confidence levels (see Péroux & Howk 2020). The simulations considered are: HM-HISSmed (thick black solid lines), P19-HISSmed (thick blue dashed lines), and FG20-HISSmed (thick orange dot-dot-dot-dashed lines), and all include HI self shielding. As a comparison, corresponding unshielded runs with the same UV backgrounds (HM, P19 and FG20) are displayed by thin lines of the same colour and style. Lower panel: corresponding evolution of ΩH2 compared to the observational constraints listed in Table A.1 (PH20 1, 2, and 3σ confidence levels, shades; ALMACAL-CO, light grey; VLASPEC, magenta; PHIBBS-2, purple; COLDz, yellow; ASPECS, green; UKIDSS-UDS, cyan; ALMACAL-abs and Hershel PEP upper and lower limits, dark grey).
Current usage metrics show cumulative count of Article Views (full-text article views including HTML views, PDF and ePub downloads, according to the available data) and Abstracts Views on Vision4Press platform.
Data correspond to usage on the plateform after 2015. The current usage metrics is available 48-96 hours after online publication and is updated daily on week days.
Initial download of the metrics may take a while.