Fig. 1.
Download original image
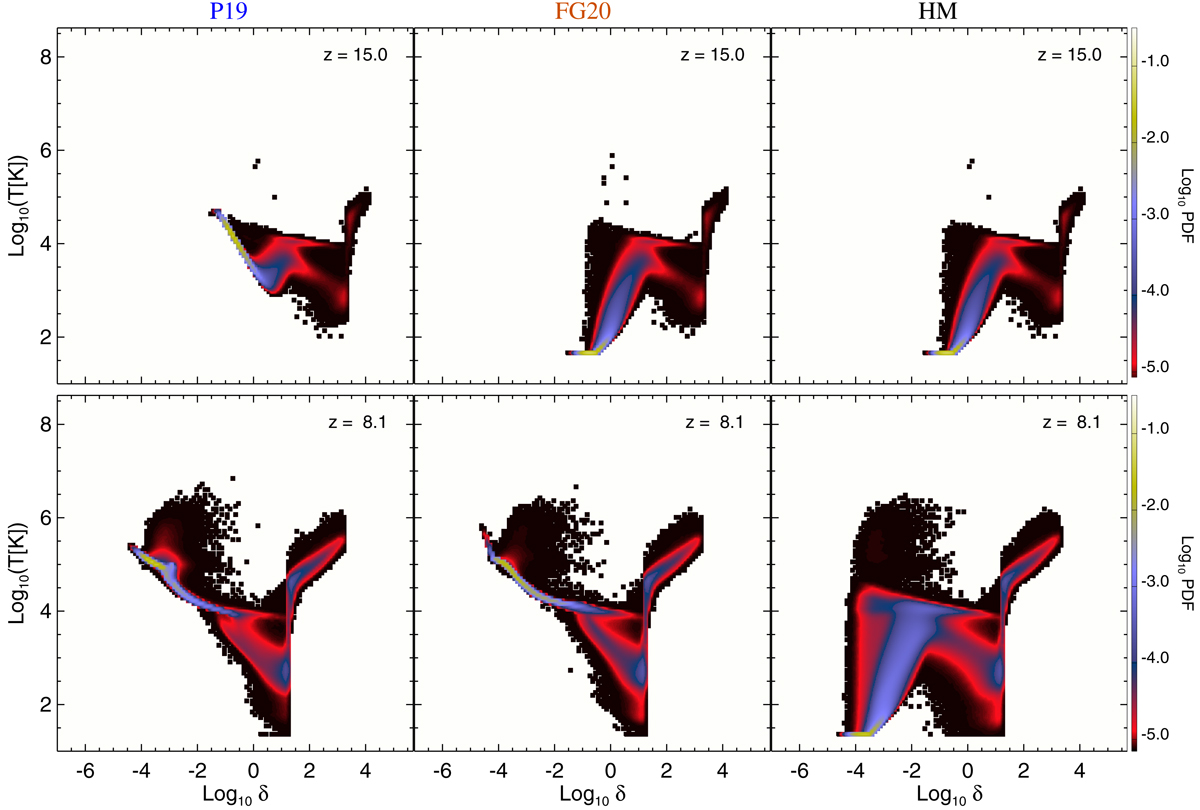
Phase diagrams at redshift z = 15.0 (upper row) and z = 8.1 (lower row) for the simulations in Table 1 run with UV rates by Puchwein et al. (2019) (P19, left), Faucher-Giguère (2020) (FG20, centre), and Haardt & Madau (1996) (HM, right). The simulation data for temperature, T, and gas overdensity with respect to the gas mean, δ, have been gridded on a base-10 logarithmic scale. The colour coding refers to the total PDF.
Current usage metrics show cumulative count of Article Views (full-text article views including HTML views, PDF and ePub downloads, according to the available data) and Abstracts Views on Vision4Press platform.
Data correspond to usage on the plateform after 2015. The current usage metrics is available 48-96 hours after online publication and is updated daily on week days.
Initial download of the metrics may take a while.