Fig. 3.
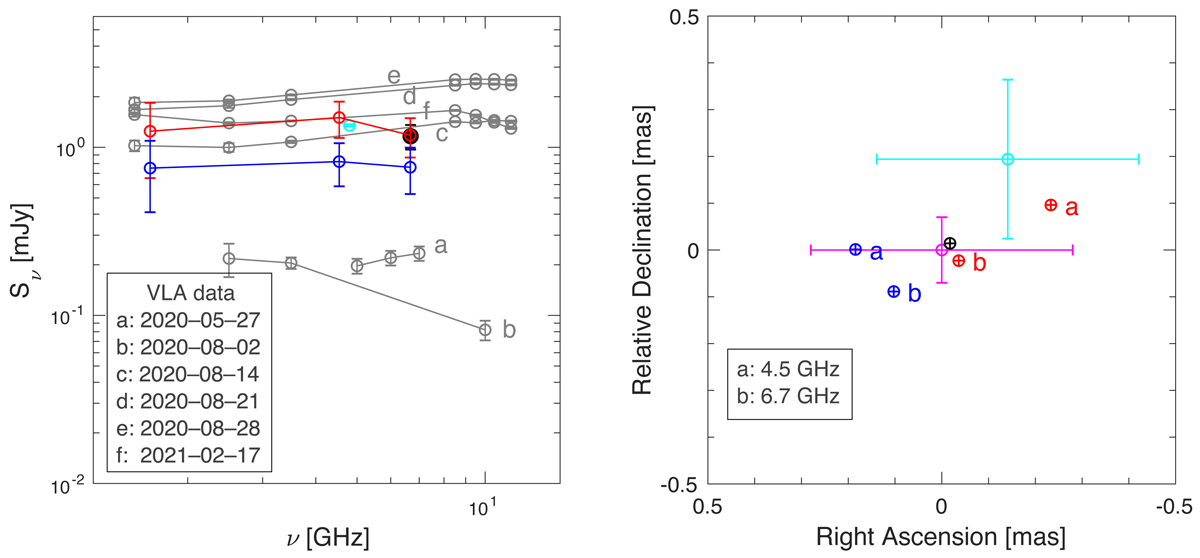
Download original image
Radio spectrum characteristics and phase-referenced positions of AT2019wey. Black: EVN epoch, red: VLBA epoch 1, blue: VLBA epoch 2, cyan: measurements by Yadlapalli et al. (2021) with the VLBA at 4.8 GHz. Left panel: flux density vs. frequency. The lines connecting the data points are not fitted curves but are simply to guide the eye. The flux densities measured by the VLA (grey; Yao et al. 2021) are also shown for comparison, and the observing dates are denoted by lowercase letters a–f accordingly. Right panel: relative astrometric positions with the average position (magenta; obtained by our five measurements listed in Table 4) as the reference point. The lowercase letters a and b correspond to 4.5 and 6.7 GHz, respectively.
Current usage metrics show cumulative count of Article Views (full-text article views including HTML views, PDF and ePub downloads, according to the available data) and Abstracts Views on Vision4Press platform.
Data correspond to usage on the plateform after 2015. The current usage metrics is available 48-96 hours after online publication and is updated daily on week days.
Initial download of the metrics may take a while.