Free Access
Fig. 2.
Download original image
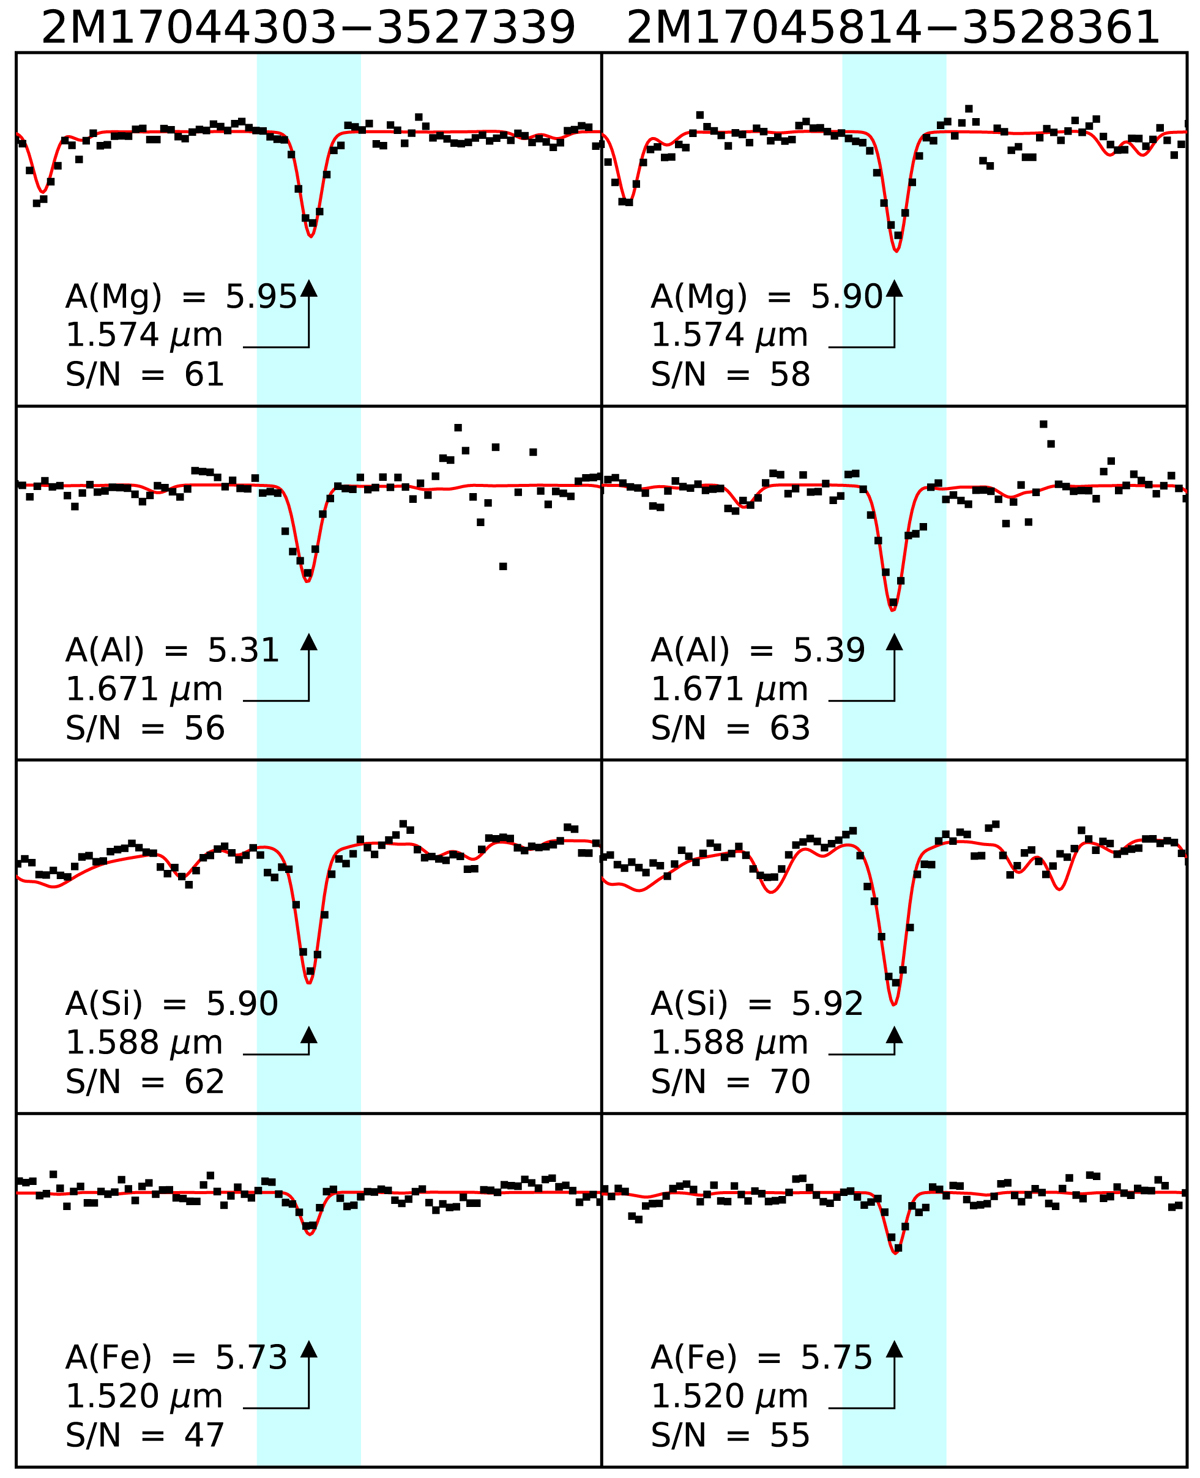
Discovery APOGEE-2S spectra of Patchick 125 members. Examples of selected Mg I, Al I, Si I, and Fe I lines are shown. Each panel shows the best-fit synthesis (red lines) from BACCHUS compared to the observed spectra (black symbols) of selected lines (marked with black arrows, and cyan shadow bands of 3.2 × 10⁻⁴ μm wide).
Current usage metrics show cumulative count of Article Views (full-text article views including HTML views, PDF and ePub downloads, according to the available data) and Abstracts Views on Vision4Press platform.
Data correspond to usage on the plateform after 2015. The current usage metrics is available 48-96 hours after online publication and is updated daily on week days.
Initial download of the metrics may take a while.