Free Access
Fig. 6
Download original image
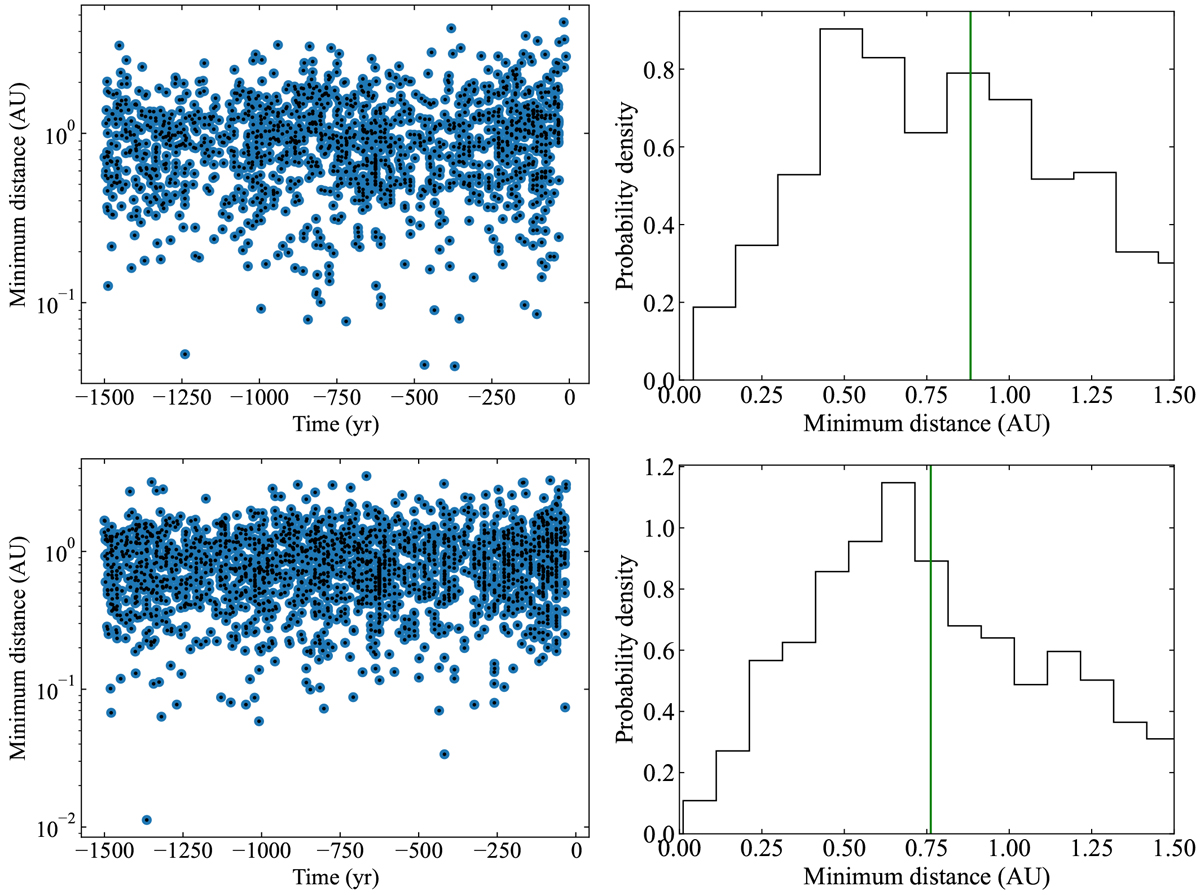
Distribution of minimum approach distances for the pair 2013 VZ70 and Fornjot. Top panels: assuming uncertainties of 10% for the barycentric Cartesian state vector of Fornjot in Table A.2. Bottom panels: assuming uncertainties of 5%. The median values are shown as vertical green lines.
Current usage metrics show cumulative count of Article Views (full-text article views including HTML views, PDF and ePub downloads, according to the available data) and Abstracts Views on Vision4Press platform.
Data correspond to usage on the plateform after 2015. The current usage metrics is available 48-96 hours after online publication and is updated daily on week days.
Initial download of the metrics may take a while.