Fig. 5.
Download original image
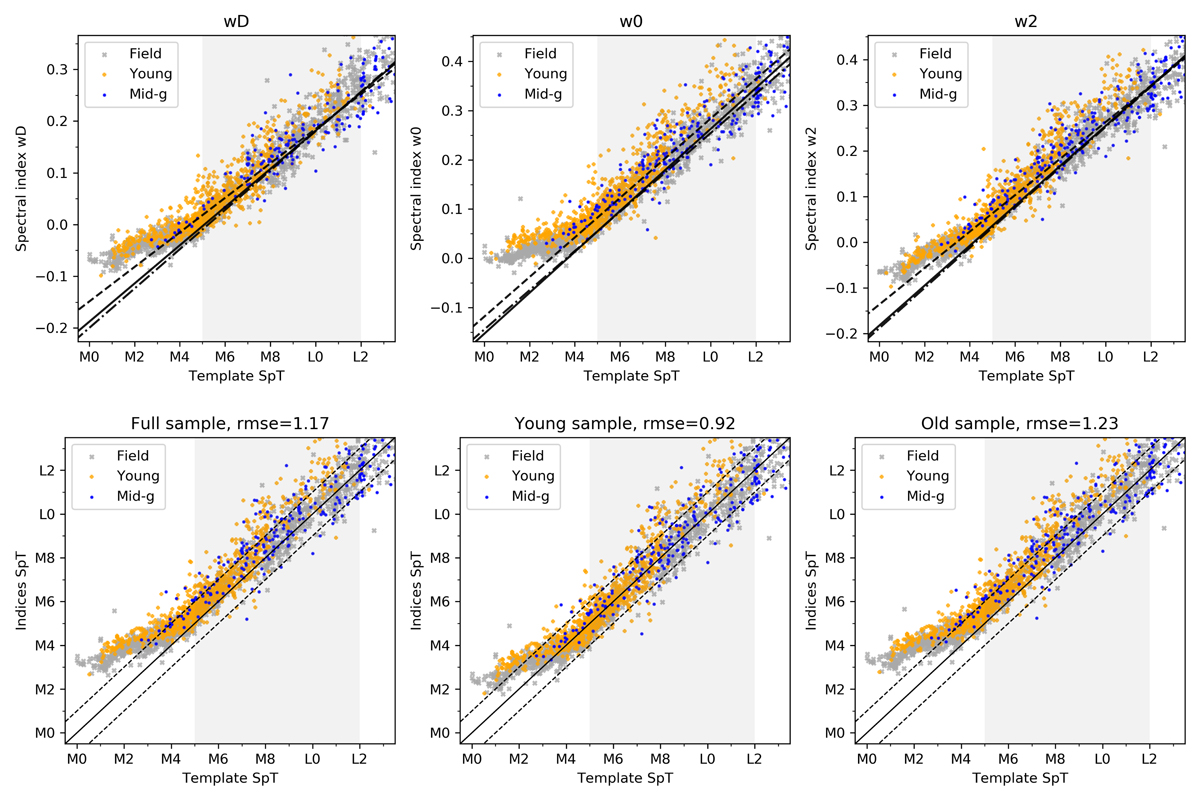
Calibration of Zhang et al. (2018) indices using our data set. Top panels: calibration of the Zhang et al. (2018) reddening-free SpT indices with the SpT derived in Sect. 3.1. Young, mid-gravity, and field objects are shown in orange, blue, and gray, respectively. The three available calibration curves are shown as solid (full sample), dashed (young sample), and dash-dotted (field sample) black lines. The shaded gray region is the original range of application. Lower panels: SpT derived for each index versus the SpT derived from the templates. The solid black line shows the 1:1 linear relationship, while the dashed lines mark a difference of one SpT.
Current usage metrics show cumulative count of Article Views (full-text article views including HTML views, PDF and ePub downloads, according to the available data) and Abstracts Views on Vision4Press platform.
Data correspond to usage on the plateform after 2015. The current usage metrics is available 48-96 hours after online publication and is updated daily on week days.
Initial download of the metrics may take a while.