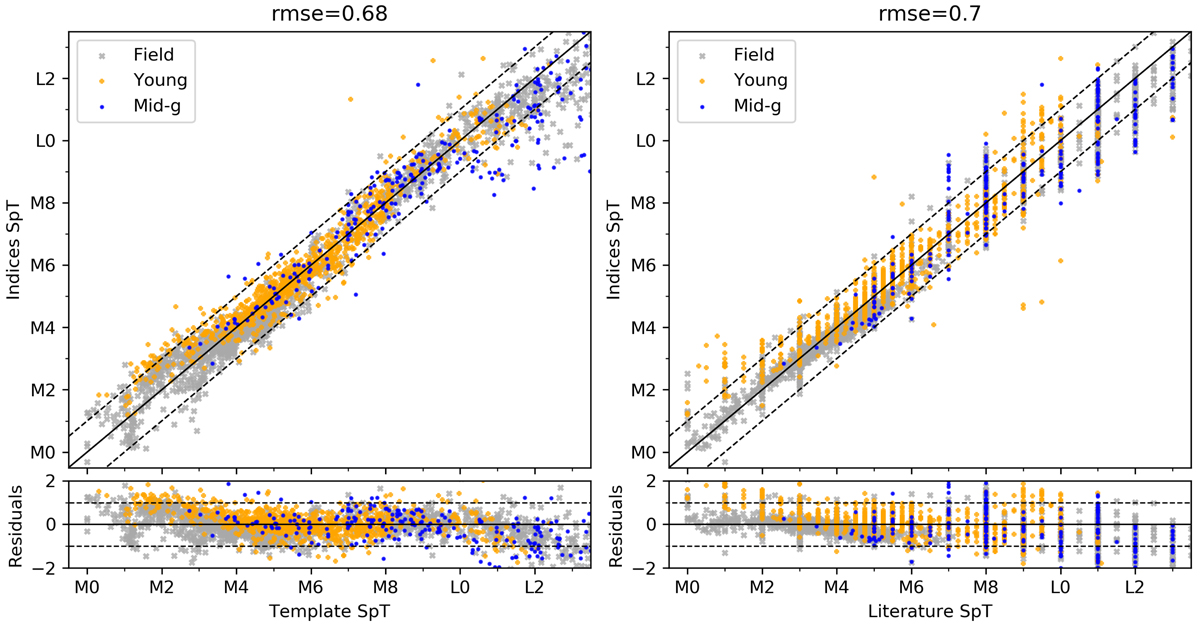
Fig. 4.
Download original image
Comparison of the SpT derived using spectral indices (Sect. 3.2) with the SpT derived using spectral templates (Sect. 3.1) and with the SpT from the literature. The solid black line represents the one-to-one correlation, and the dashed lines represent ±1 sub-SpT. In the bottom region of the figure we show the residuals of the comparison.
Current usage metrics show cumulative count of Article Views (full-text article views including HTML views, PDF and ePub downloads, according to the available data) and Abstracts Views on Vision4Press platform.
Data correspond to usage on the plateform after 2015. The current usage metrics is available 48-96 hours after online publication and is updated daily on week days.
Initial download of the metrics may take a while.