Fig. 3.
Download original image
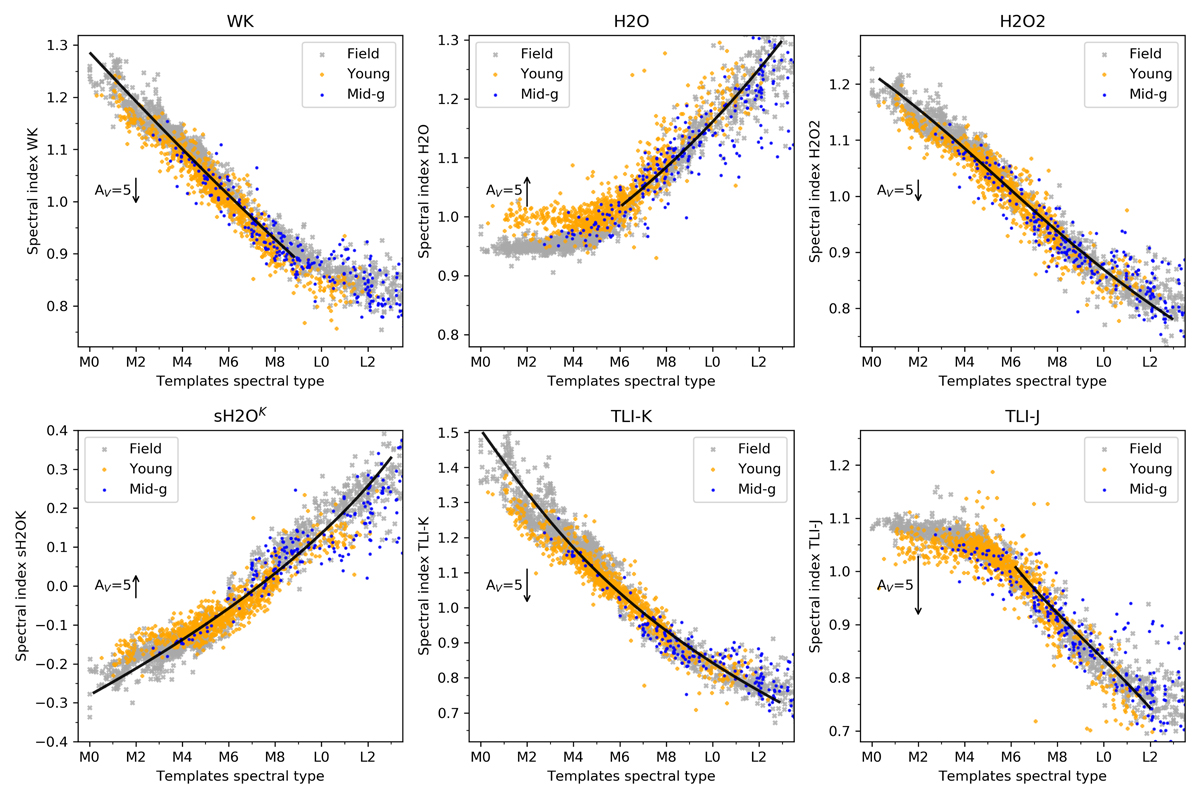
Selected literature and new SpT indices versus the SpT derived from the comparison to templates (Sect. 3.1). Young, mid-gravity, and field objects are shown in orange, blue, and gray, respectively. The derived calibration curve is shown as a solid black line over the sensitivity range of each index. The black arrows show the effect that an addition of five magnitudes of extinction would have on the index values.
Current usage metrics show cumulative count of Article Views (full-text article views including HTML views, PDF and ePub downloads, according to the available data) and Abstracts Views on Vision4Press platform.
Data correspond to usage on the plateform after 2015. The current usage metrics is available 48-96 hours after online publication and is updated daily on week days.
Initial download of the metrics may take a while.