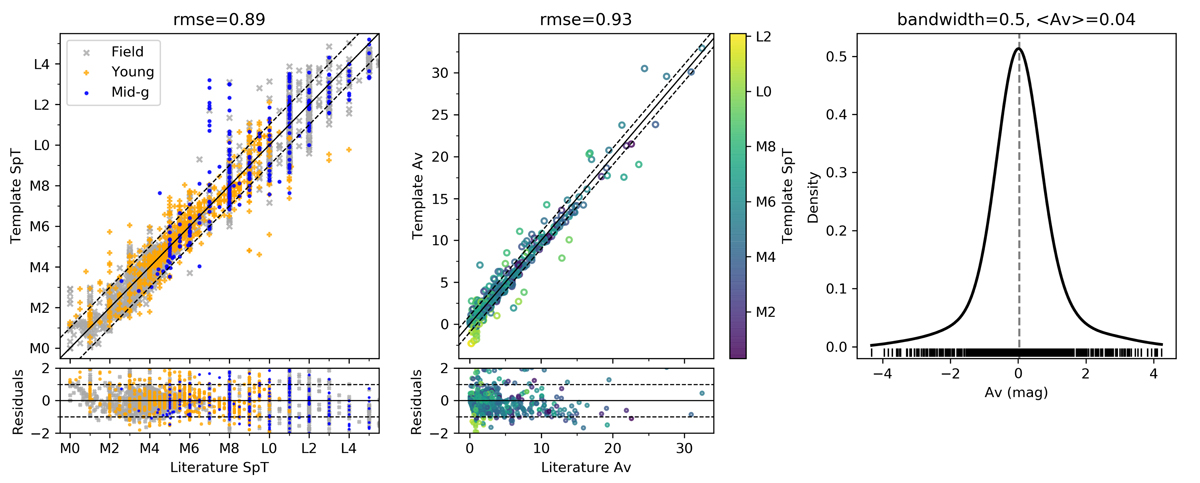
Fig. 2.
Download original image
Results of the template fitting process explained in Sect. 3.1. Left panel: comparison of the literature SpT with the derived SpT and the residuals; gray crosses, blue circles, and orange plus marks refer to the field, mid-gravity, and young classes. Middle panel: extinction derived in this method compared with the literature value and the residuals, only for objects in SFRs, color-coded with the literature SpT. Right panel: the KDE of the extinction for the low-extinction objects (field and NYMGs) with a bandwidth of 0.5. The mean value is shown in gray.
Current usage metrics show cumulative count of Article Views (full-text article views including HTML views, PDF and ePub downloads, according to the available data) and Abstracts Views on Vision4Press platform.
Data correspond to usage on the plateform after 2015. The current usage metrics is available 48-96 hours after online publication and is updated daily on week days.
Initial download of the metrics may take a while.