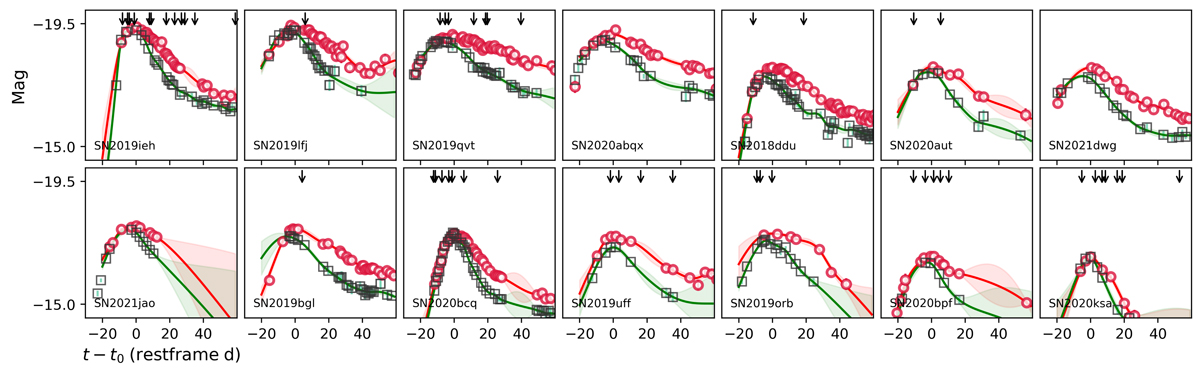
Fig. 3.
Download original image
Light curves of the final sample of 14 Type Ibc SNe plotted in separate panels. We plot g- (green squares) and r-band (red circles) photometry in absolute AB magnitudes. These are corrected for distance and MW extinction. The x-axis gives rest-frame days since r-band peak, where the redshifts and explosion dates are provided in Tables 3 and 4. The dashed lines are the GP interpolations with error regions that were used to estimate peak explosion magnitudes and their uncertainties. Black arrows on top indicate the dates when we obtained spectra.
Current usage metrics show cumulative count of Article Views (full-text article views including HTML views, PDF and ePub downloads, according to the available data) and Abstracts Views on Vision4Press platform.
Data correspond to usage on the plateform after 2015. The current usage metrics is available 48-96 hours after online publication and is updated daily on week days.
Initial download of the metrics may take a while.