Fig. 2.
Download original image
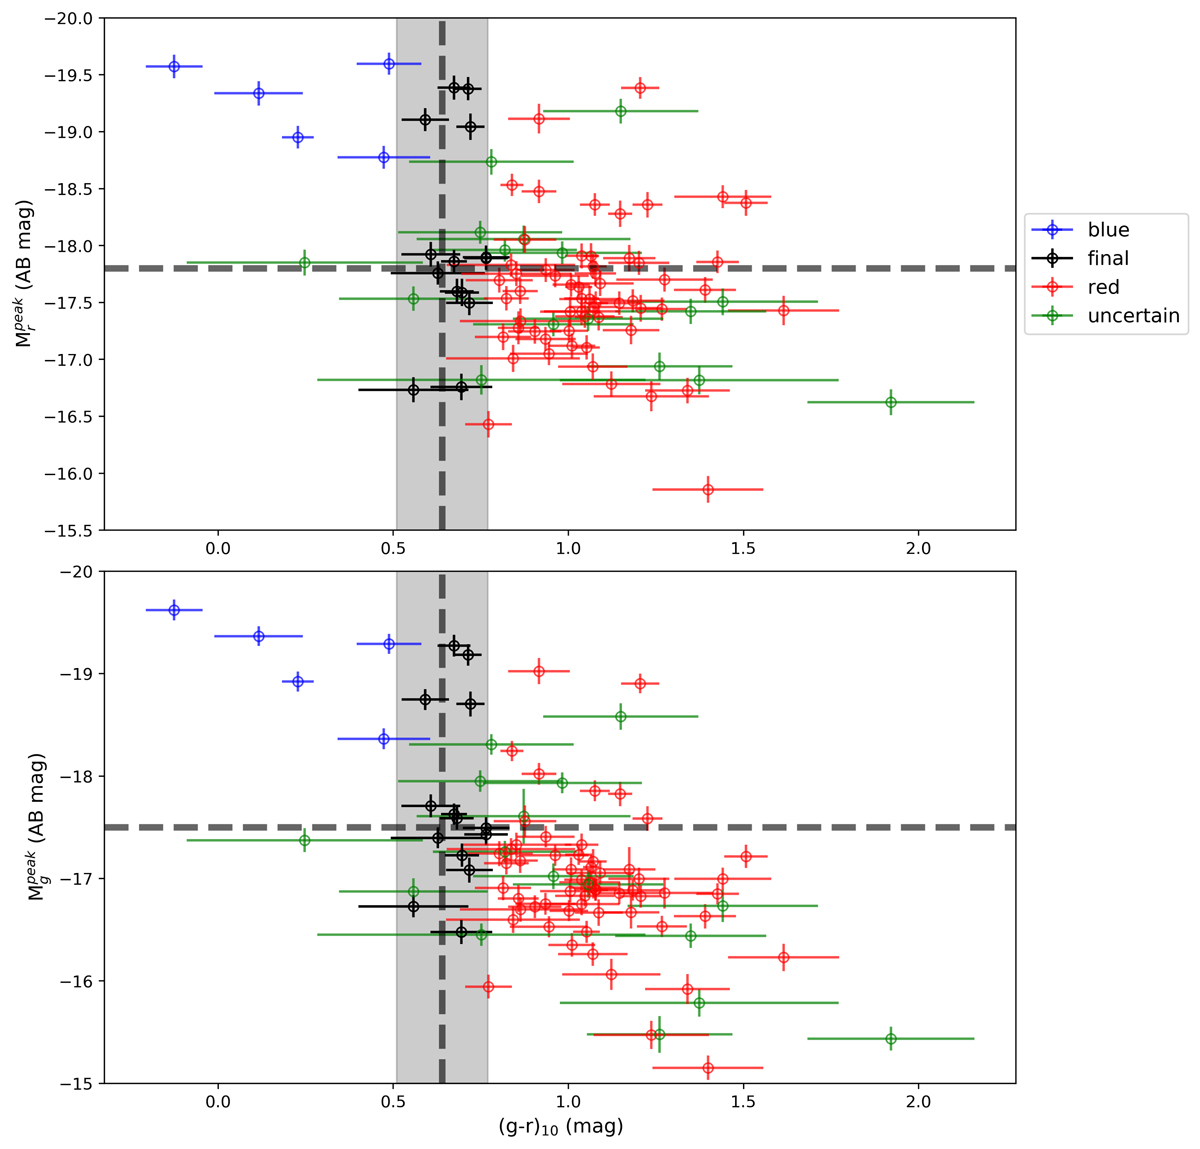
Colors and color cuts for the sample selections of Type Ibc SNe. The figure shows the absolute peak magnitudes (Mr in the upper and Mg in the lower panel) for the 94 SNe selected versus their MW corrected colors in g − r at ∼10 days after peak, when these transients have the most uniform color distribution (Taddia et al. 2015; Stritzinger et al. 2018). The gray box includes those 14 SNe kept in the final sample as normal SNe Ibc where uncertainties in the extinction corrections are smaller. The color coding is explained in the main text. The horizontal dashed lines represent the maximum luminosities (Mg = −17.5, Mr = −17.8), according to Woosley et al. (2021). The data points also have uncertainties in magnitudes assigned, according to the error propagation in Sect. 3.4.
Current usage metrics show cumulative count of Article Views (full-text article views including HTML views, PDF and ePub downloads, according to the available data) and Abstracts Views on Vision4Press platform.
Data correspond to usage on the plateform after 2015. The current usage metrics is available 48-96 hours after online publication and is updated daily on week days.
Initial download of the metrics may take a while.