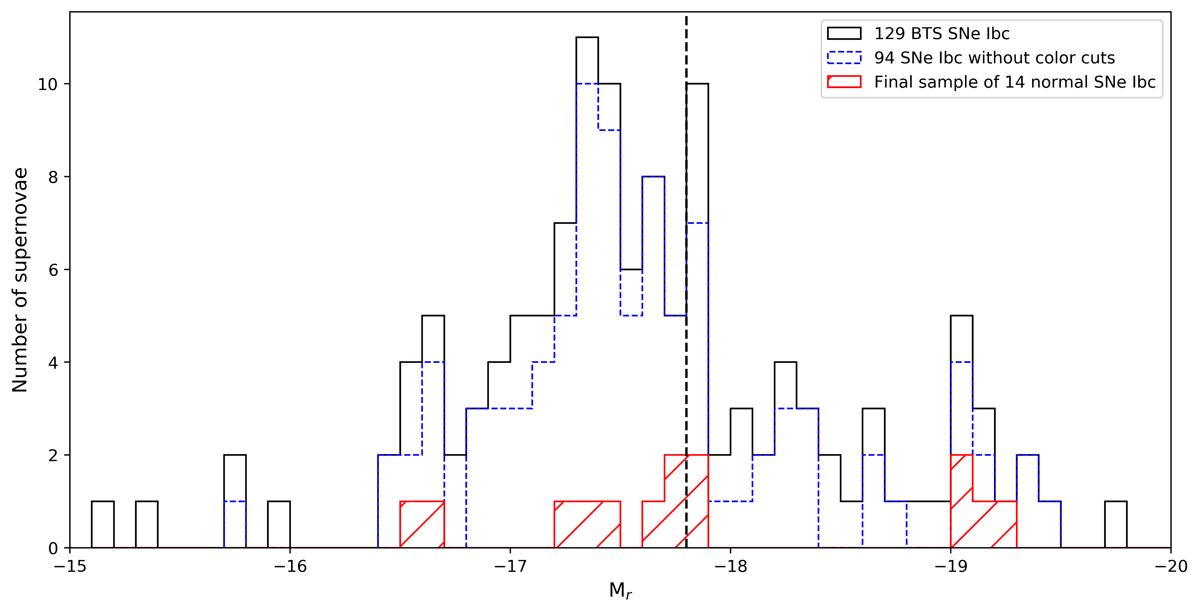
Fig. 1.
Download original image
Luminosity function for Type Ibc SNe. The figure shows the number of objects per absolute magnitude bin (Mr) for different sample selections. The black distribution is for the 129 SNe Ibc initially selected from the BTS explorer and using the absolute magnitudes from that site. This distribution has an average and standard deviation of Mg/r = −17.61 ± 0.72 mag. The blue dashed distribution is for the 94 SNe Ibc that is kept after additional quality cuts have been implemented. These magnitudes are measured using GP on forced photometry data and yield Mr = −17.64 ± 0.54 mag. The red distribution of the final 14 normal SNe Ibc has an average and standard deviation of Mr = −17.90 ± 0.73 mag. The vertical black dashed line marks the upper limit of Mr = −17.8 from Woosley et al. (2021).
Current usage metrics show cumulative count of Article Views (full-text article views including HTML views, PDF and ePub downloads, according to the available data) and Abstracts Views on Vision4Press platform.
Data correspond to usage on the plateform after 2015. The current usage metrics is available 48-96 hours after online publication and is updated daily on week days.
Initial download of the metrics may take a while.