Fig. 3
Download original image
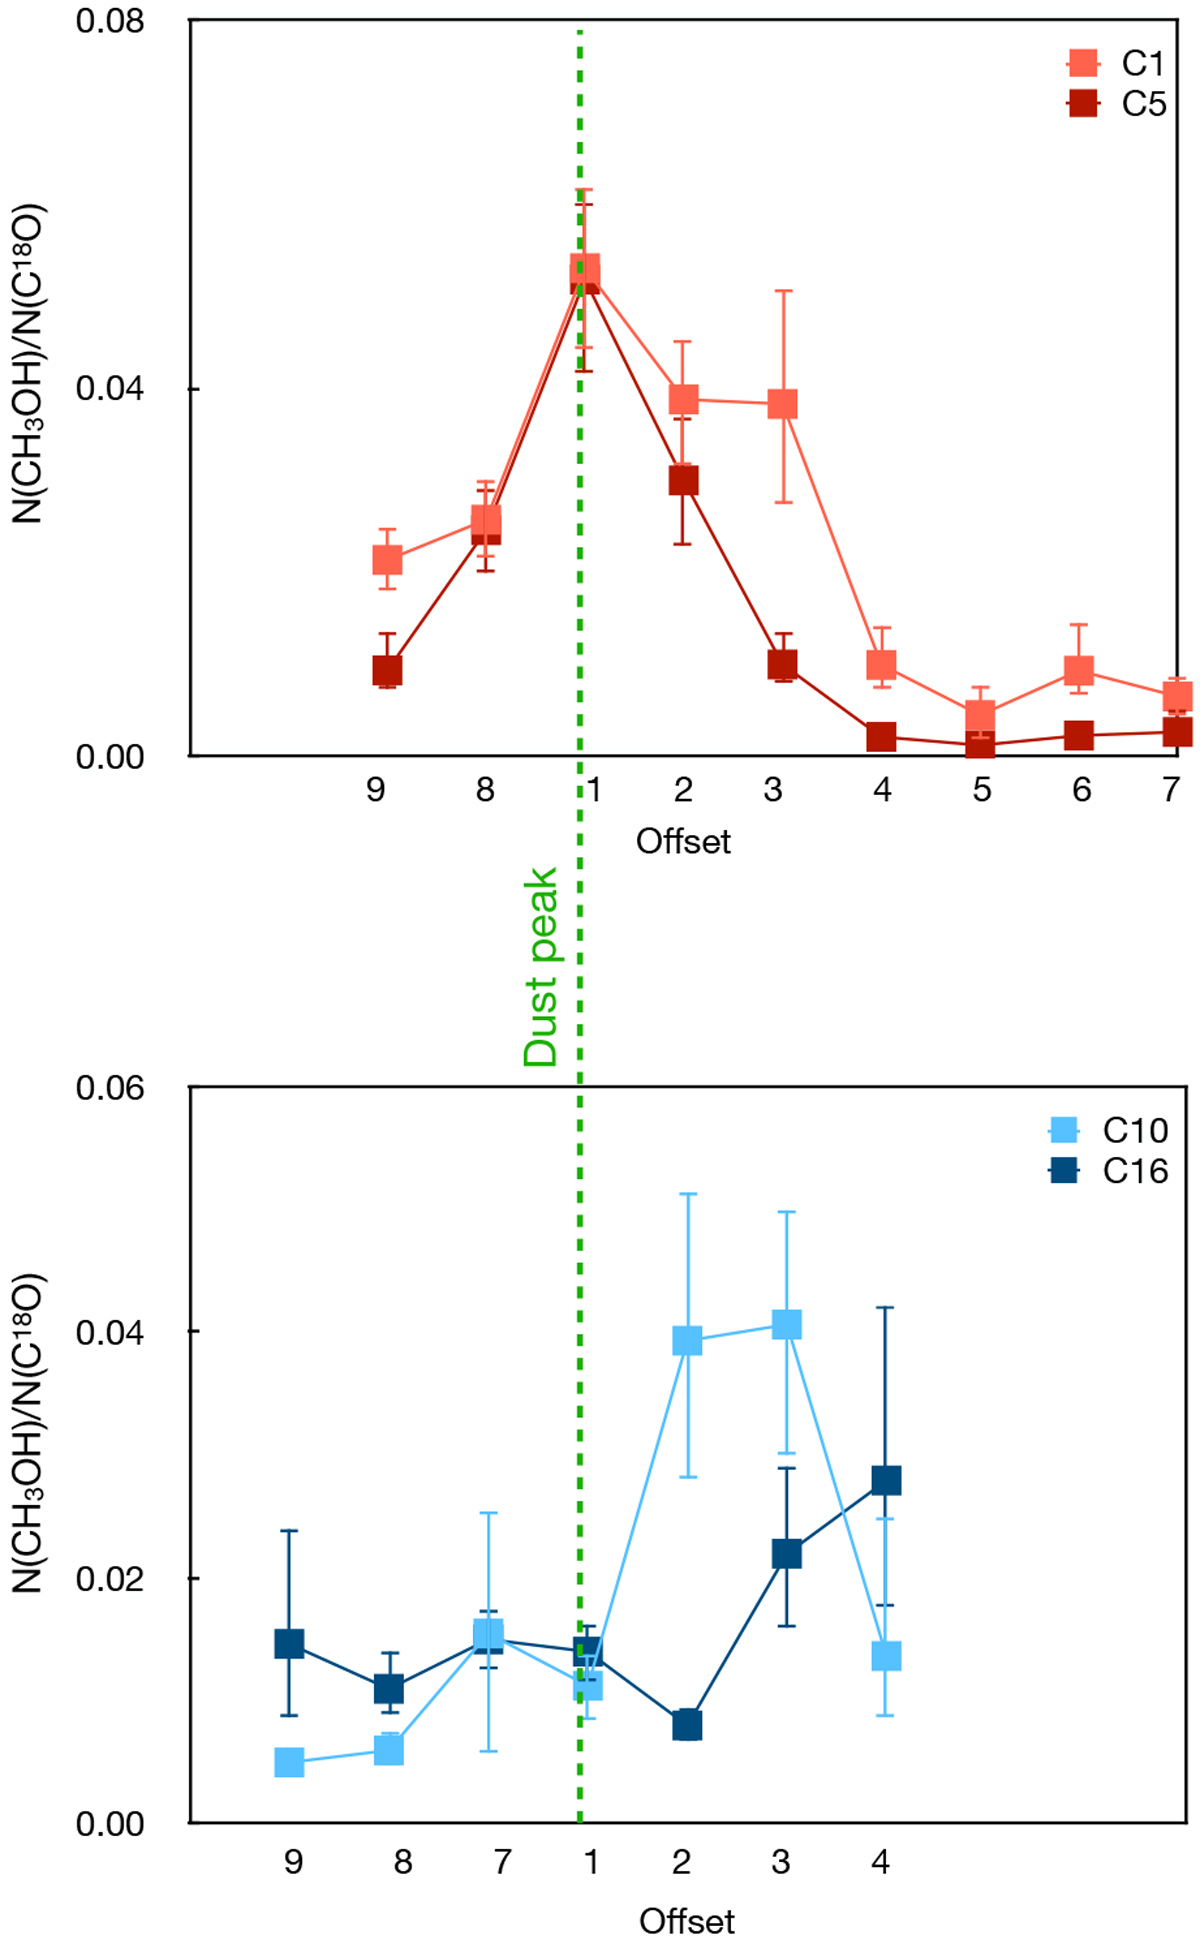
Upper panel: methanol and C18O column density ratio for two cores in the north of B213, C1 and C5. Lower panel: methanol and C18O column density ratio for two cores in the south of B213, C10 and C16. The column density ratios are plotted with respect to the observed offsets, and offset 1 always refers to the dust peak (also shown as a dashed green line). The positions of the offsets in the cores are shown in Figs. A.15, A.17, A.20, and A.22.
Current usage metrics show cumulative count of Article Views (full-text article views including HTML views, PDF and ePub downloads, according to the available data) and Abstracts Views on Vision4Press platform.
Data correspond to usage on the plateform after 2015. The current usage metrics is available 48-96 hours after online publication and is updated daily on week days.
Initial download of the metrics may take a while.