Fig. B.1
Download original image
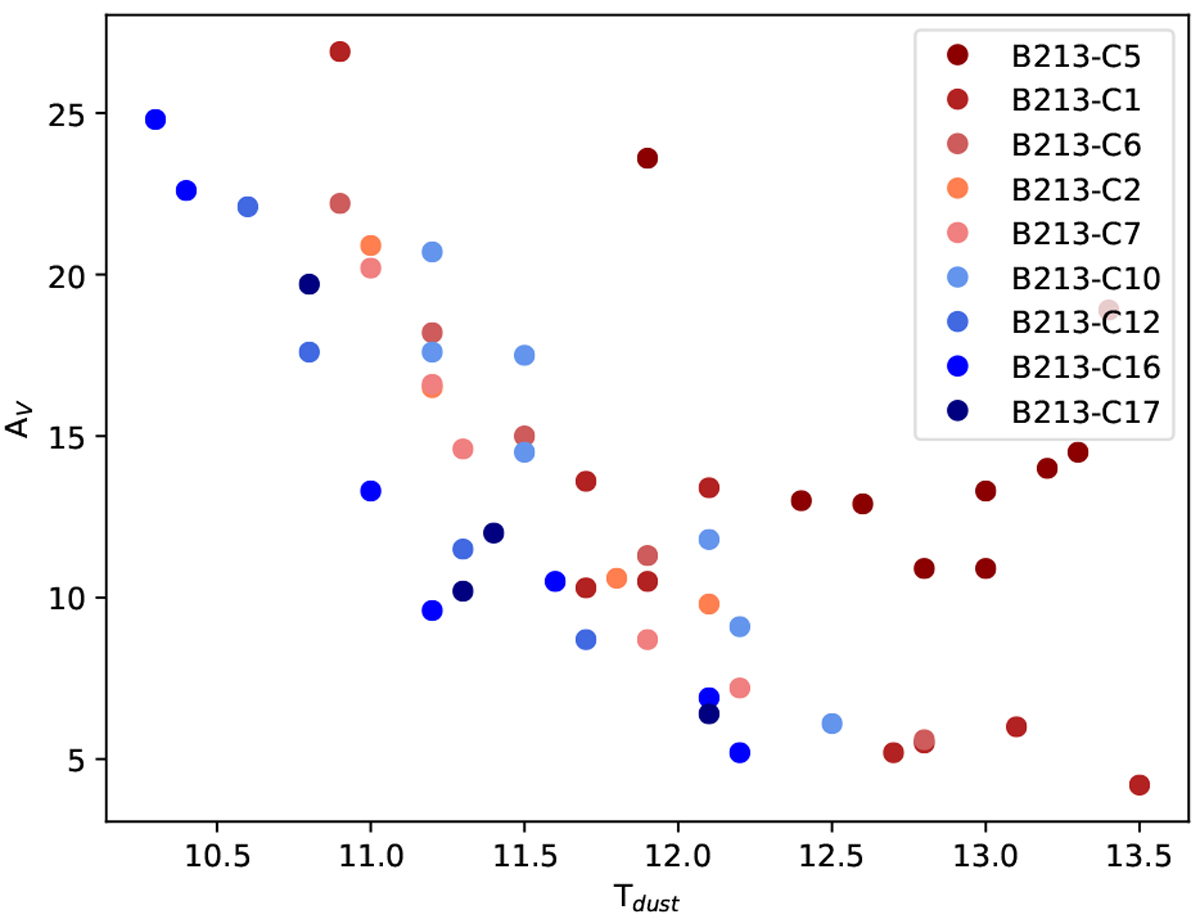
AV and Tdust in the B213 cores within our sample are plotted against each other to show the effect of the larger stellar activity in the northern part of B213. In this Figure, the cores in the north of B213 are plotted in different shades of red that go from darker to lighter when moving from north to south. The cores in the central and southern part of B213 are plotted in different shades of blue, with the darkest being the core located more to the south.
Current usage metrics show cumulative count of Article Views (full-text article views including HTML views, PDF and ePub downloads, according to the available data) and Abstracts Views on Vision4Press platform.
Data correspond to usage on the plateform after 2015. The current usage metrics is available 48-96 hours after online publication and is updated daily on week days.
Initial download of the metrics may take a while.