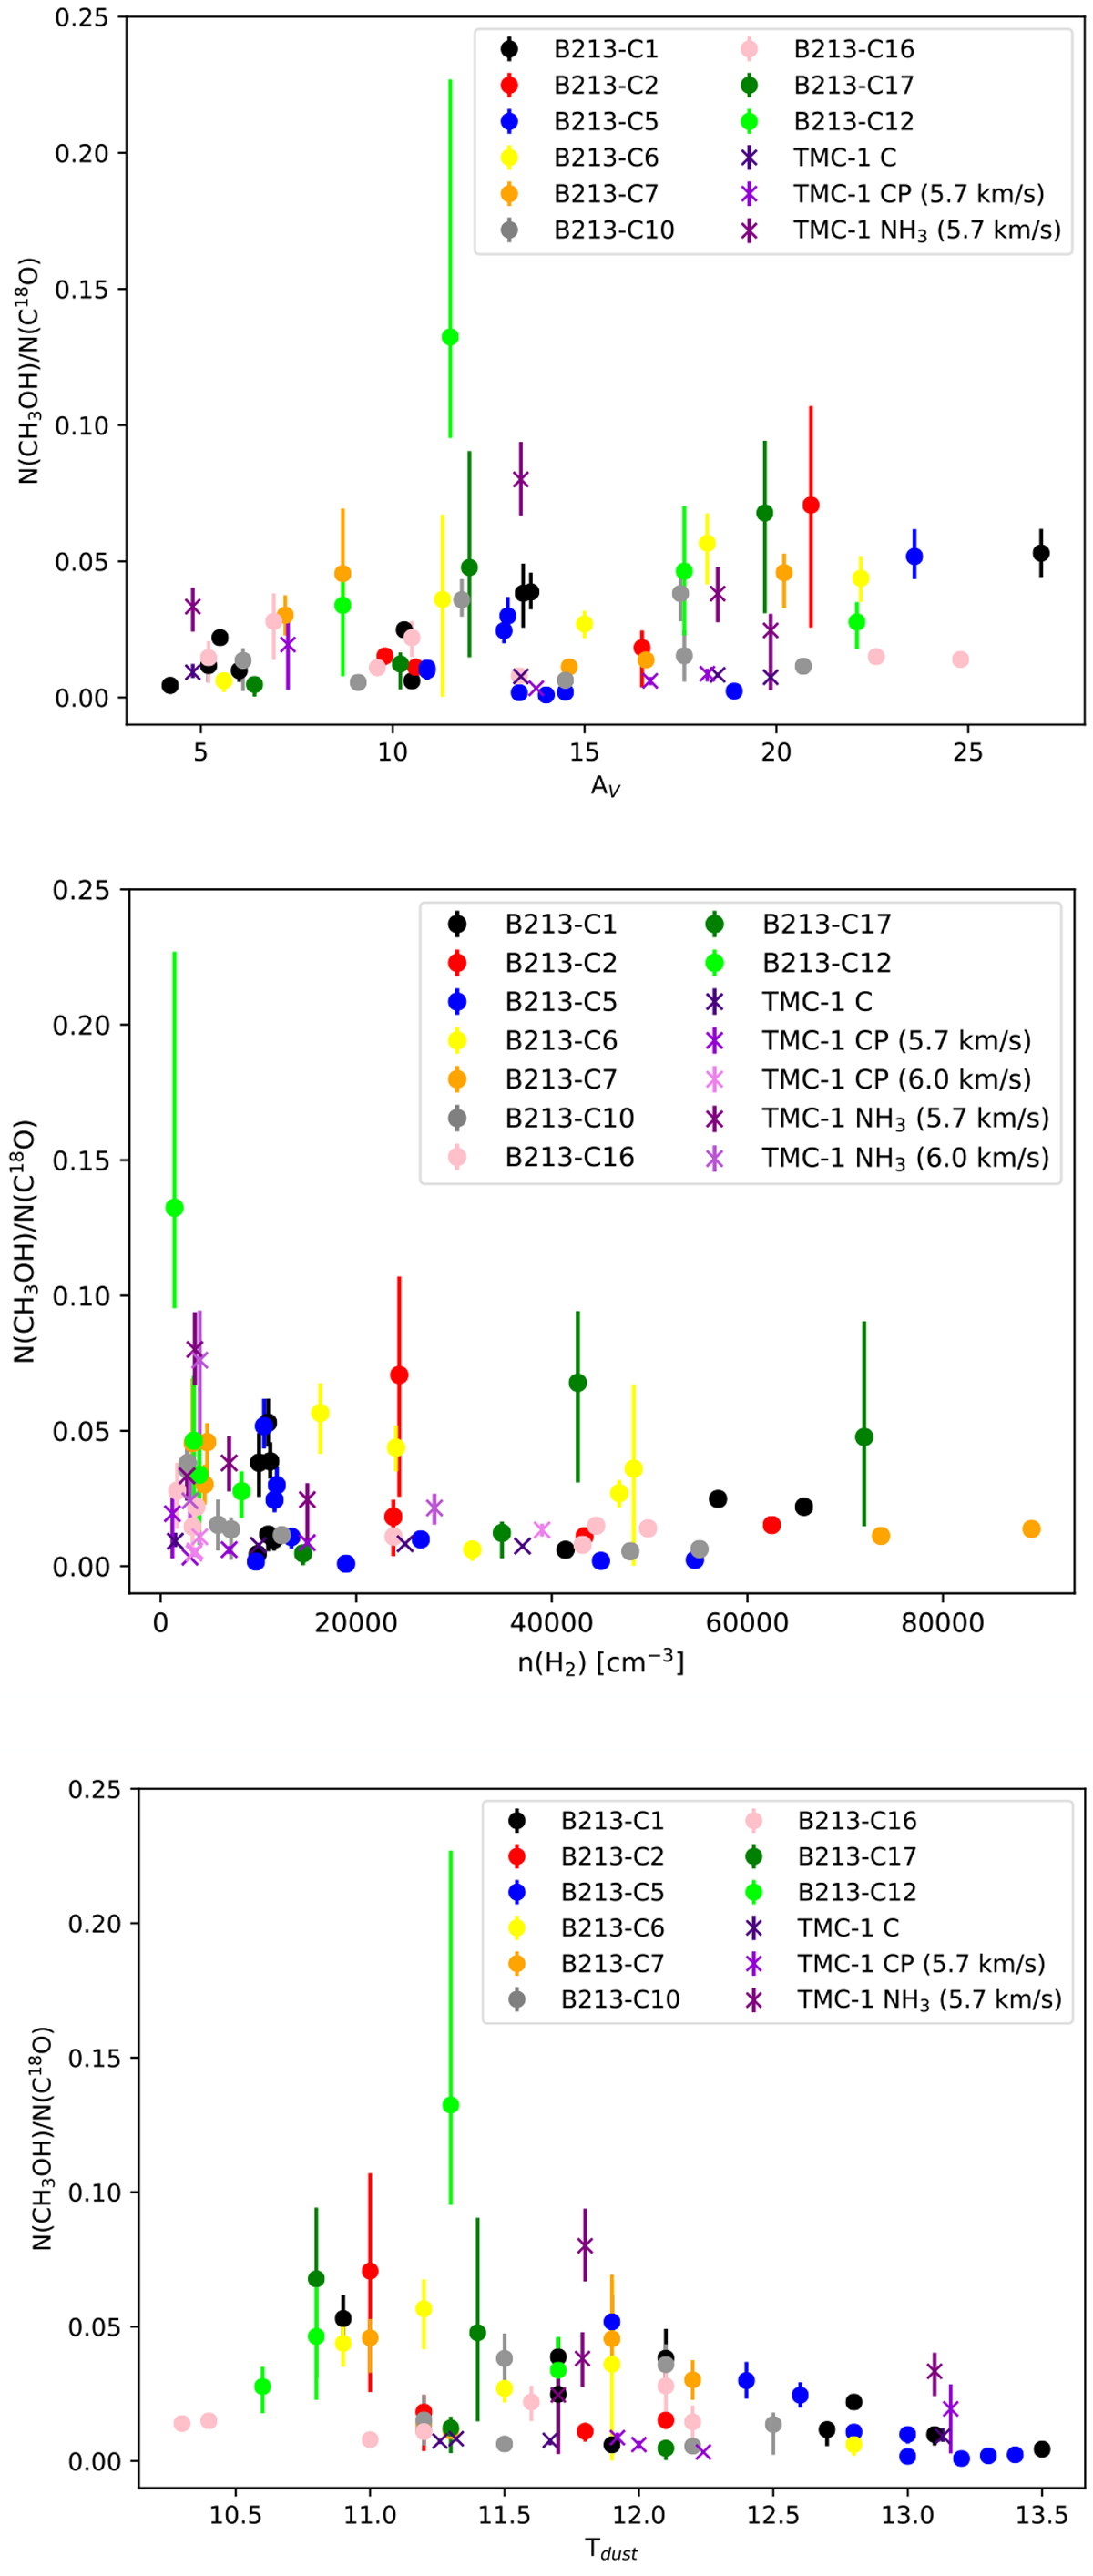
Fig. 2
Download original image
Methanol and C18O column density ratios computed in all positions within our sample plotted against the: visual extinctions derived from Herschel and Planck data (Palmeirim et al. 2013; Rodríguez-Baras et al. 2021) (upper panel); volume density derived from the MCMC+RADEX analysis of the methanol lines (central panel); Tdust derived fromHerschel data in Rodríguez-Baras et al. (2021) (lower panel).
Current usage metrics show cumulative count of Article Views (full-text article views including HTML views, PDF and ePub downloads, according to the available data) and Abstracts Views on Vision4Press platform.
Data correspond to usage on the plateform after 2015. The current usage metrics is available 48-96 hours after online publication and is updated daily on week days.
Initial download of the metrics may take a while.