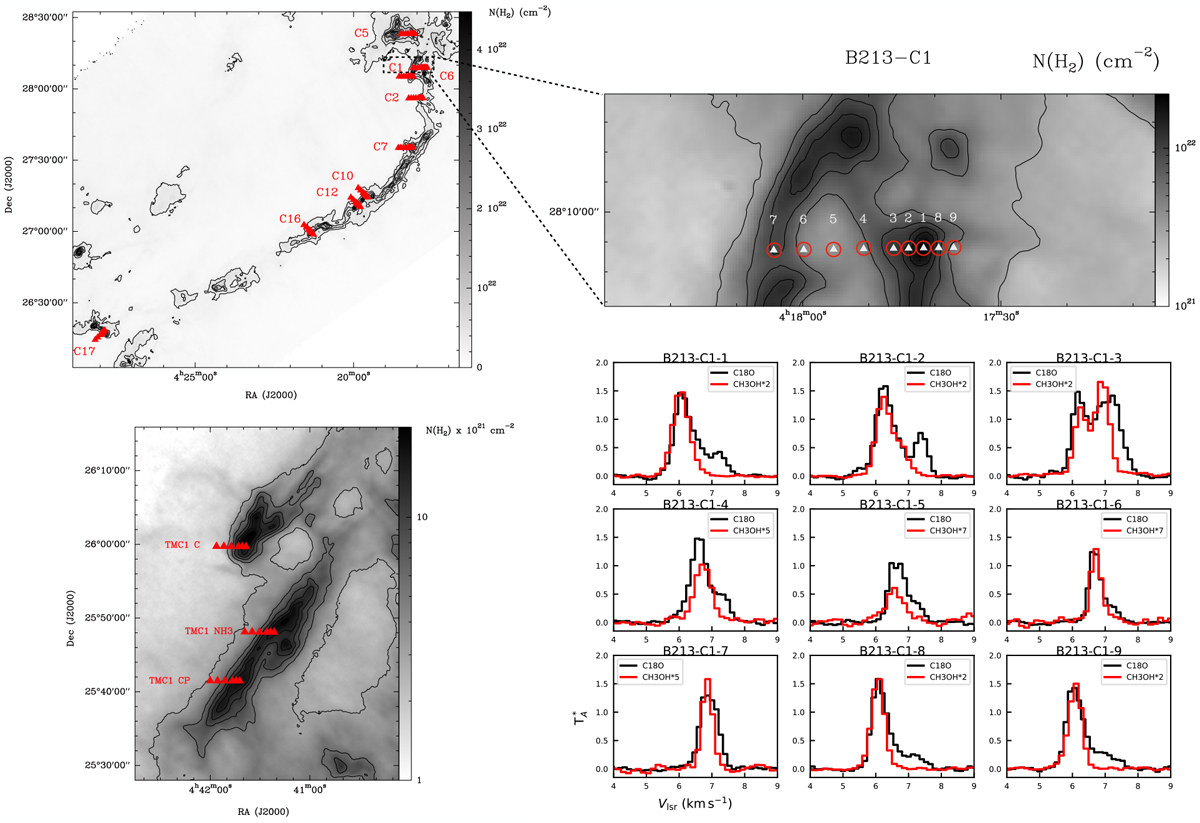
Fig. 1
Download original image
Left panels: H2 column density map of the TMC-1 molecular cloud (lower panel) and the B213 filament (upper panel) in Taurus,computed from Herschel and Planck data (Palmeirim et al. 2013; Rodríguez-Baras et al. 2021). The offsets observed towards the starless cores in our dataset are marked with a triangle. Right panel: H2 column density of B213-C1 (upper panel). The triangles mark the positions observed with the GEMS large project, and the red circles show the beam size of the IRAM 30 m telescope at 97 GHz (~26″). The spectra of the 21,2–11,1 (E2) transition of methanol (in red) overlaid with the J = 1–0 transition of C18O (in black) inall offsets towards B213-C1 are shown in the lower panel.
Current usage metrics show cumulative count of Article Views (full-text article views including HTML views, PDF and ePub downloads, according to the available data) and Abstracts Views on Vision4Press platform.
Data correspond to usage on the plateform after 2015. The current usage metrics is available 48-96 hours after online publication and is updated daily on week days.
Initial download of the metrics may take a while.