Fig. 6.
Download original image
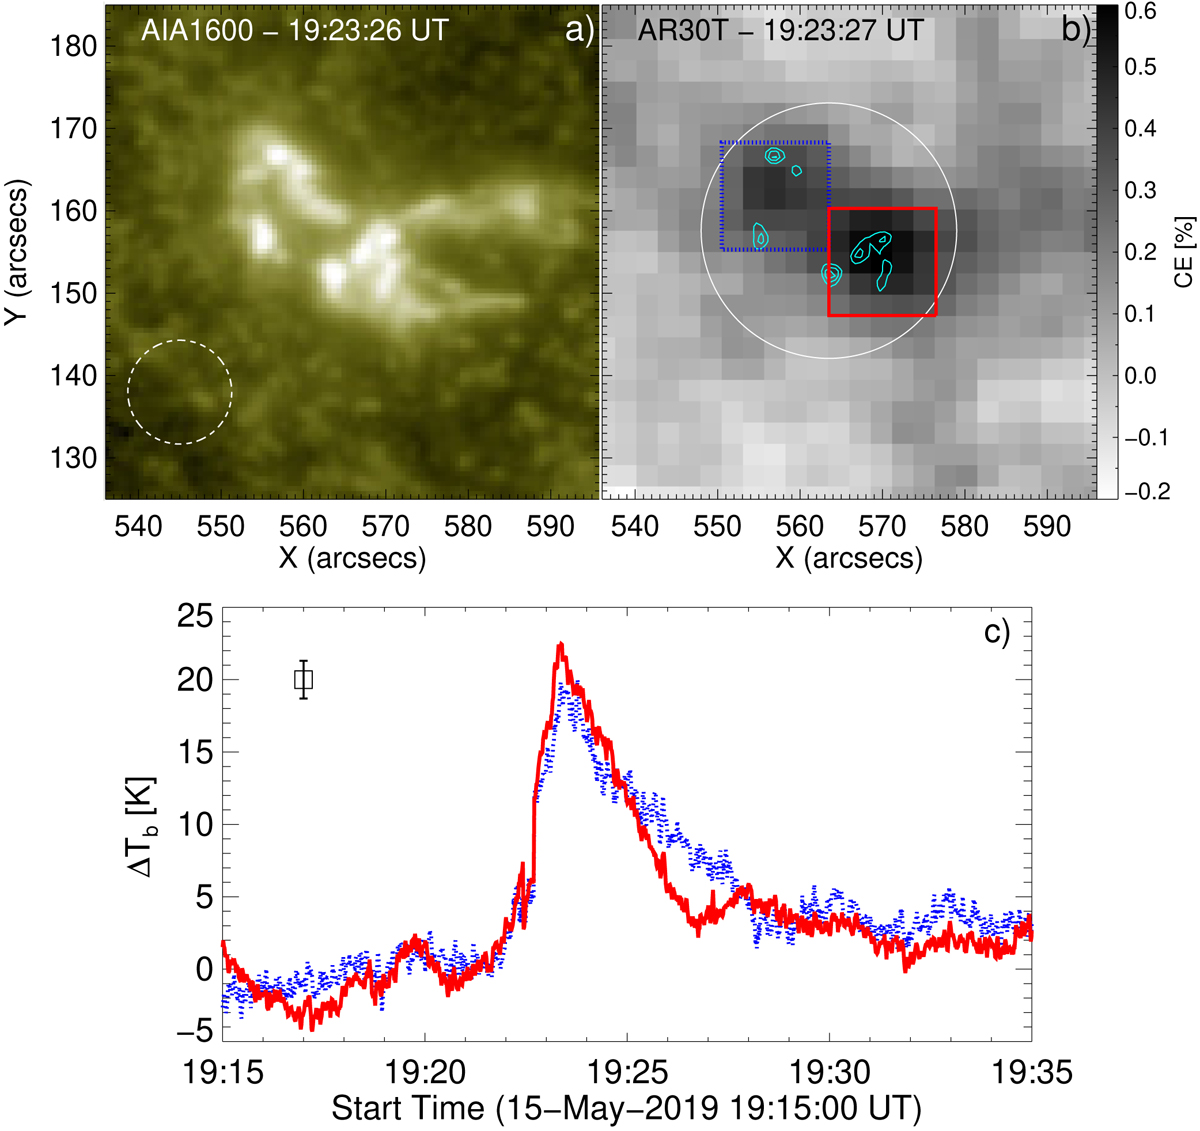
Close view of the mid-IR and UV sources. Panel a shows the flaring region observed by AIA1600. The dashed white circle indicates the size of the Airy disk of the AR30T. Panel b displays the two bright kernels observed in 30 THz after pre-event subtraction with colors inverted (black is more intense). The dotted-blue and red boxes enclose the northern and southern kernels respectively. The contour levels are 50, 70, and 90% of the flare maximum in AIA1600. The white circle indicates the area used to estimate the mid-IR temporal evolution displayed in Fig. 5. The excess brightness temperature averaged for the boxes shown in the upper panel (with the respective blue and red color) is shown in panel c. The error bar indicates 1σ uncertainty in ΔTb.
Current usage metrics show cumulative count of Article Views (full-text article views including HTML views, PDF and ePub downloads, according to the available data) and Abstracts Views on Vision4Press platform.
Data correspond to usage on the plateform after 2015. The current usage metrics is available 48-96 hours after online publication and is updated daily on week days.
Initial download of the metrics may take a while.