Fig. 5.
Download original image
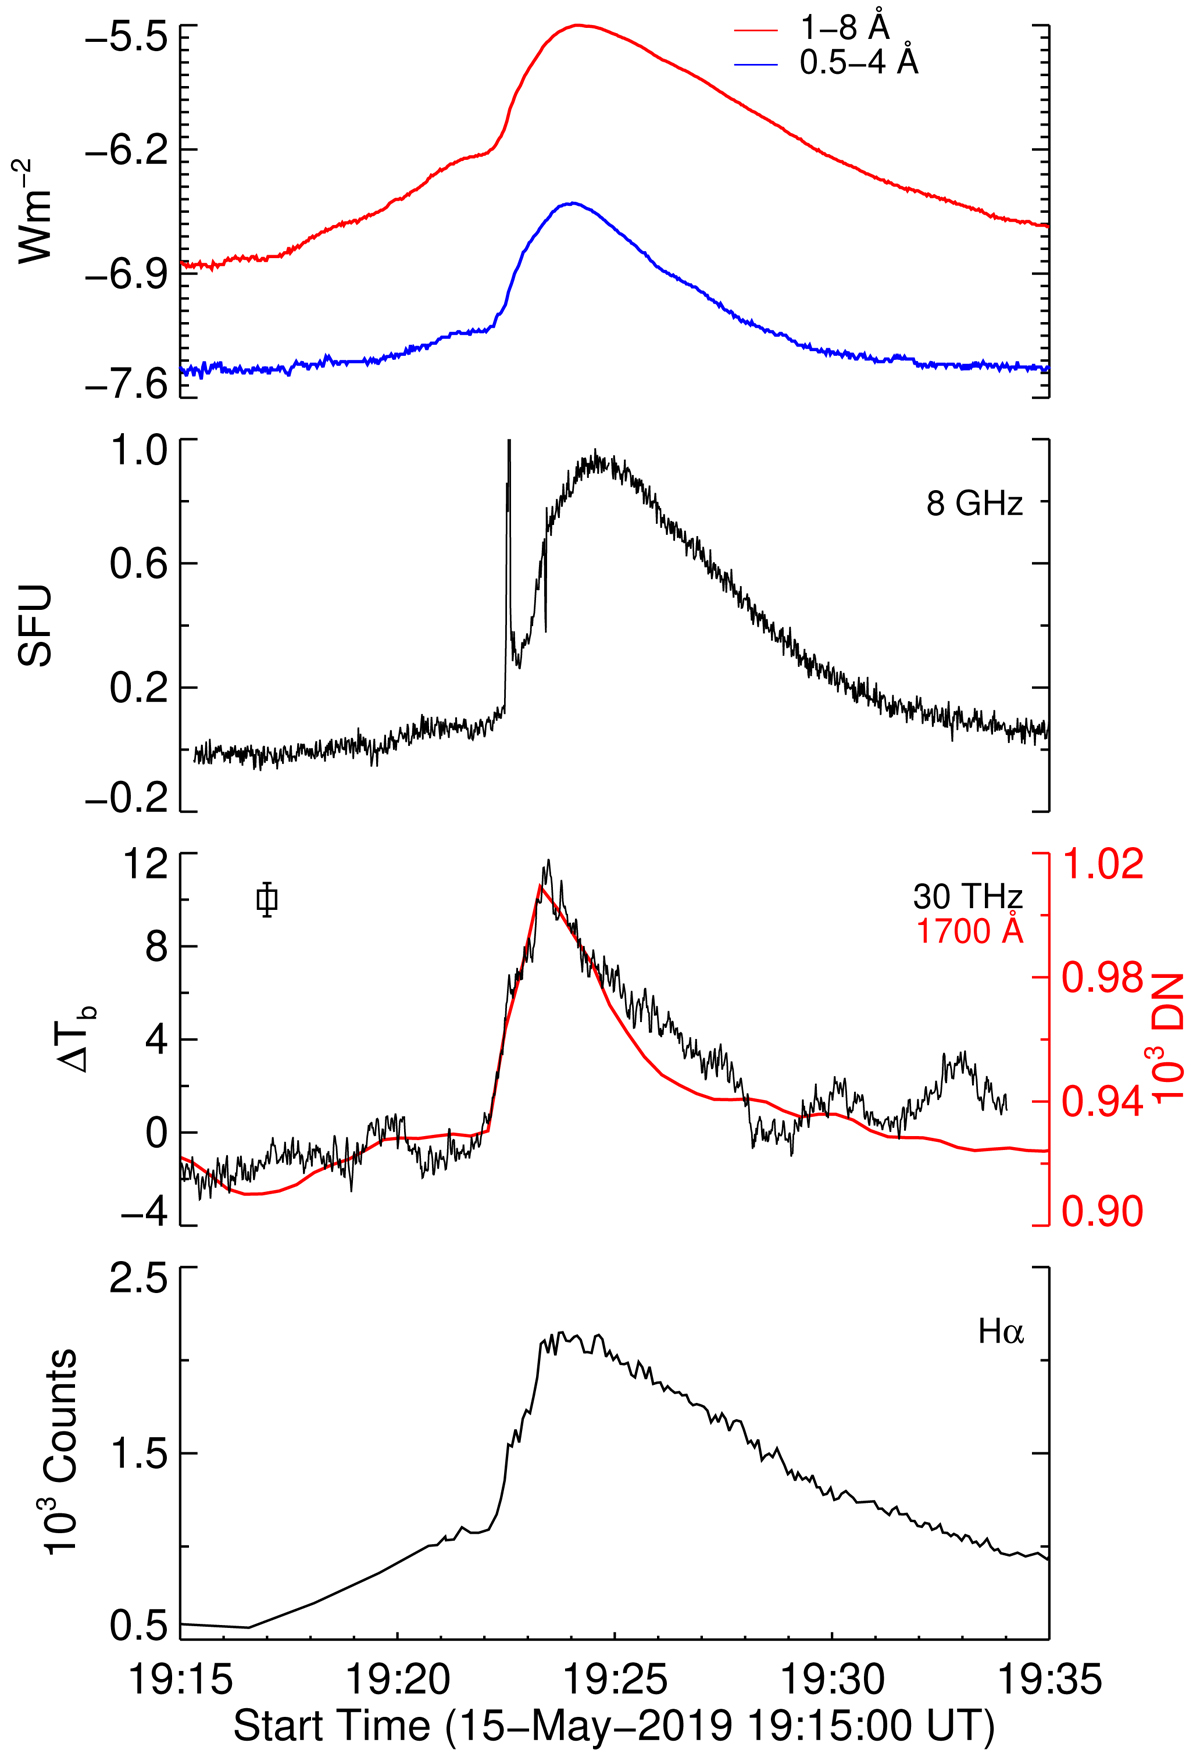
Temporal evolution at selected wavelengths. From top to bottom: GOES soft X-rays 1–8 and 0.5–4 Å, EOVSA 8 GHz, AR30T mid-IR (30 THz), AIA 1700 Å and HASTA Hα. The error bar shown at the top left of the 30 THz plot corresponds to 1σ uncertainty in ΔTb. The sharp peak visible in the 8 GHz curve during the impulsive phase of the flare extends up to ∼3 SFU. SFU = solar flux unit.
Current usage metrics show cumulative count of Article Views (full-text article views including HTML views, PDF and ePub downloads, according to the available data) and Abstracts Views on Vision4Press platform.
Data correspond to usage on the plateform after 2015. The current usage metrics is available 48-96 hours after online publication and is updated daily on week days.
Initial download of the metrics may take a while.