Fig. 4.
Download original image
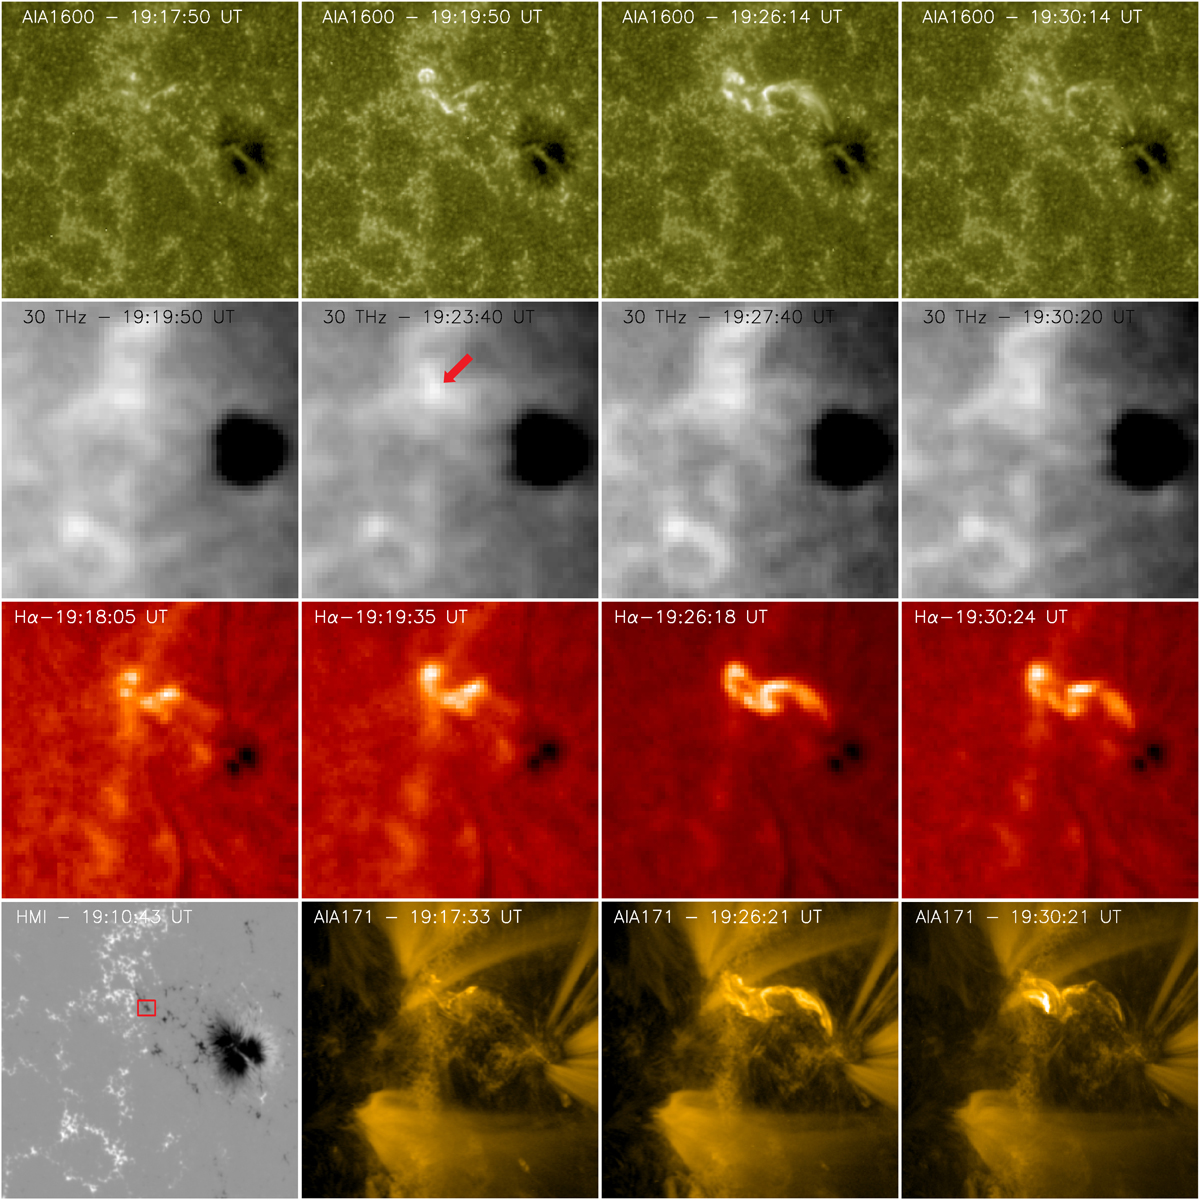
Sequence of images of AR 12741 during the flare. The different rows show, from top to bottom, images of AIA1600, mid-IR, Hα, and a combination of HMI and AIA171 maps, between 19:15 to 19:30 UT, covering the whole event. The locations of flare kernels at flare onset are clear in the second panel of AIA1600, while later some loop structures appear bright, and by its end a small kernel is seen on the large negative polarity (see also the movie AIA1600.mp4 available online). In the second panel of the second row, the red arrow indicates the location of the flaring region in the 30 THz data, which is comparable to the location with AIA1600. These 30 THz features can be better seen in panel b of Fig. 6. In the third row, the kernels are well observed in Hα and they correspond well to the ones of AIA1600. At upper coronal heights, the flare evolution can be followed in the three last panels, last row, in AIA171 (see also the movie AIA171.mp4 available online). A clear small loop structure is seen connecting the kernels seen in AIA1600 and a larger elongated structure is seen to the west towards the spot. The first panel in this row depicts the HMI magnetic field as a reference for the location and polarity sign of the different flare features. The red square in this panel encompasses the region where we compute the negative flux variation shown in Fig. 3. All panels cover the same field of view; their sizes and the convention for the magnetic field maps are the same as in Fig. 2.
Current usage metrics show cumulative count of Article Views (full-text article views including HTML views, PDF and ePub downloads, according to the available data) and Abstracts Views on Vision4Press platform.
Data correspond to usage on the plateform after 2015. The current usage metrics is available 48-96 hours after online publication and is updated daily on week days.
Initial download of the metrics may take a while.