Fig. 3.
Download original image
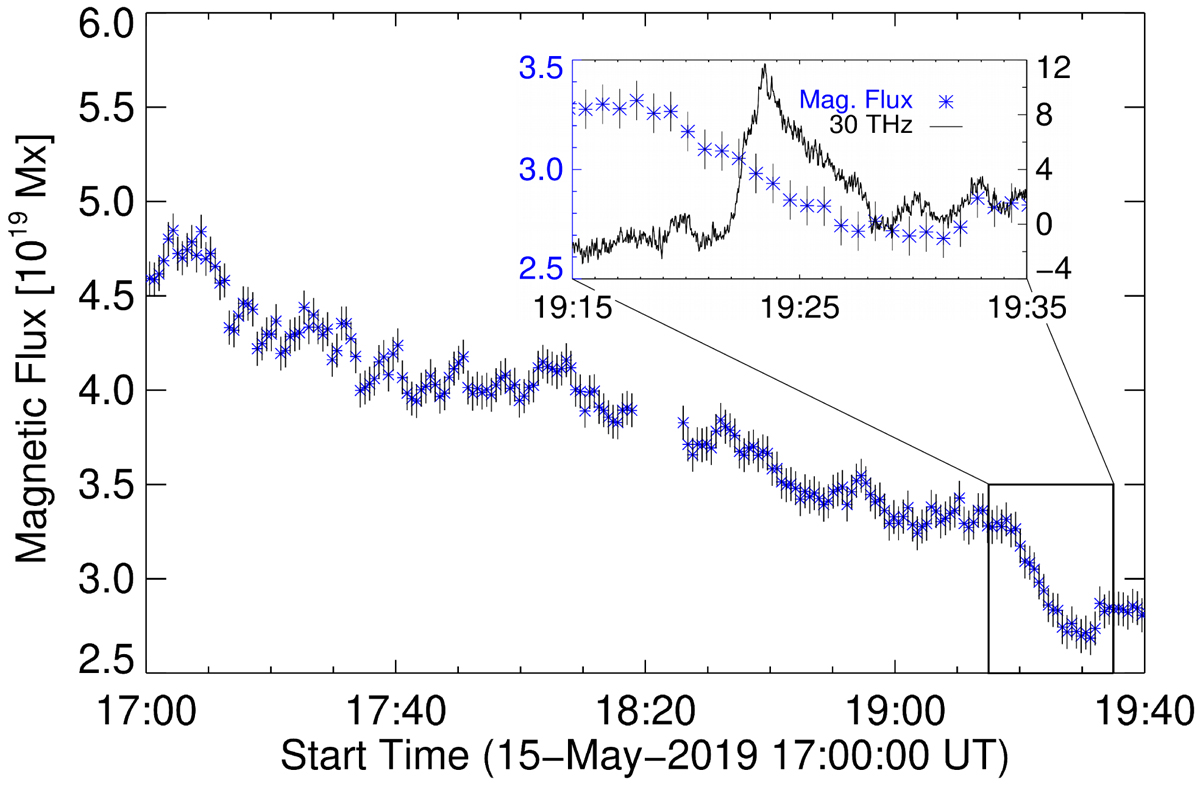
Evolution of the absolute value of the negative magnetic flux in the region surrounded by the red square shown in the first panel, last row, of Fig. 4. Computations are done for values of the field below −10 G and the error bars are calculated considering a magnetic field error of 5 G. The time evolution between 19:15 and 19:35 UT, is zoomed in the upper-right corner and displayed together with the temporal evolution of the excess brightness temperature in 30 THz (see Fig. 5 and Sect. 3.3 for details about mid-IR brightness temperature calculation).
Current usage metrics show cumulative count of Article Views (full-text article views including HTML views, PDF and ePub downloads, according to the available data) and Abstracts Views on Vision4Press platform.
Data correspond to usage on the plateform after 2015. The current usage metrics is available 48-96 hours after online publication and is updated daily on week days.
Initial download of the metrics may take a while.