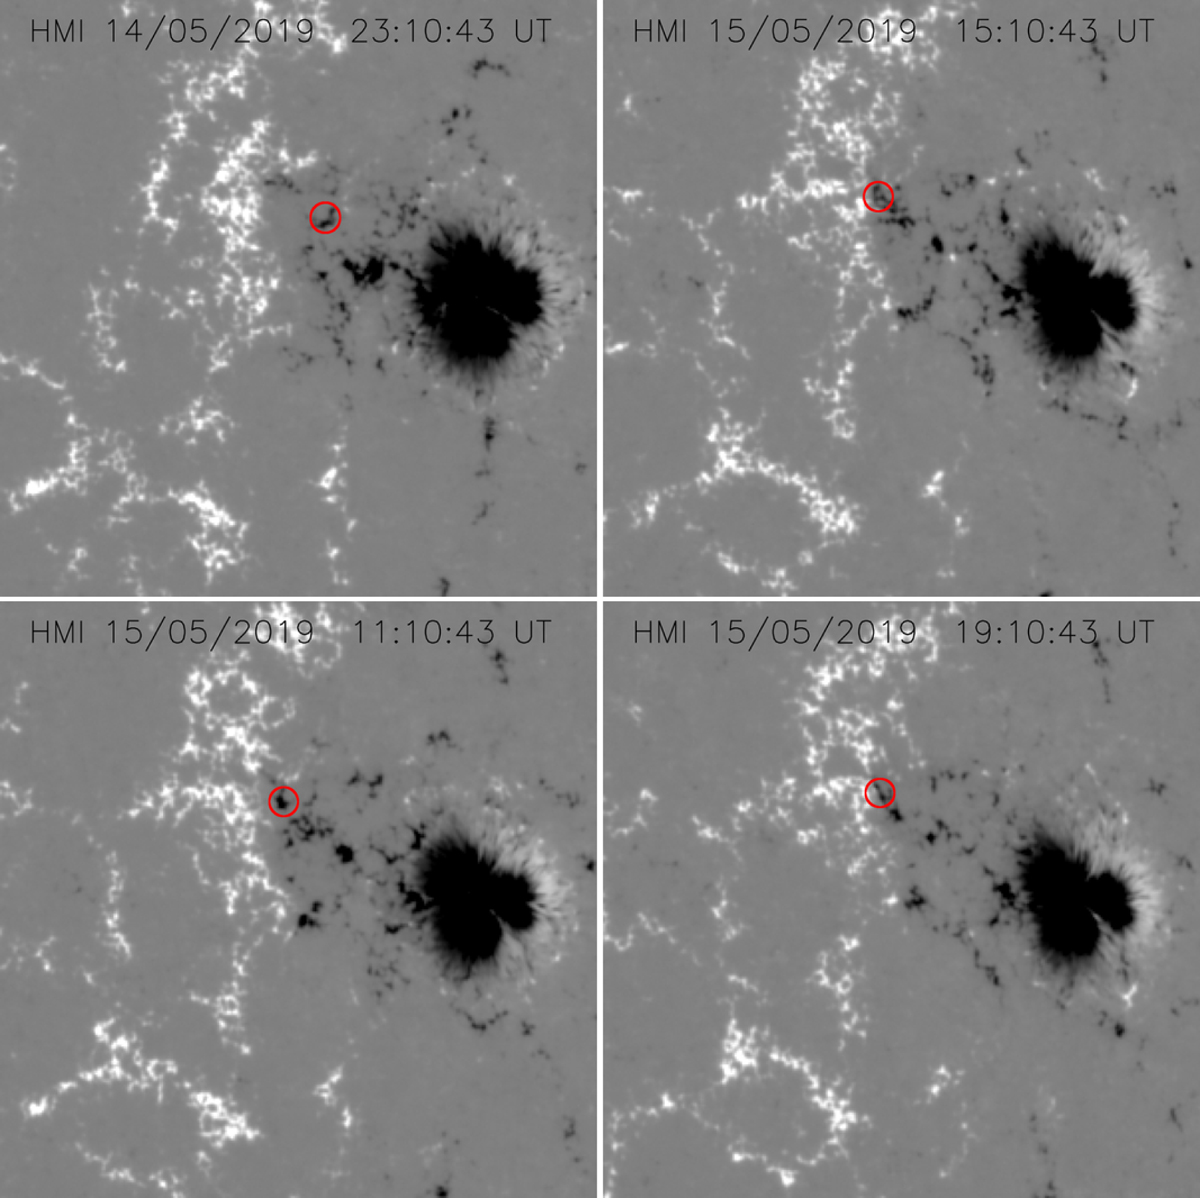
Fig. 2.
Download original image
SDO/HMI line-of-sight magnetograms of AR 12741 on 15 May 2019 with a 45 s time resolution. The red circles mark the small negative feature that we track to compute the moat flow speed at different times. Its evolution indicates that as it moves closer to the positive field its flux disperses and decreases. The convention for the field intensity is the same as in Fig. 1 and the images have a horizontal and vertical sizes of 150″. The online movie HMI-15May.mpeg complements this figure.
Current usage metrics show cumulative count of Article Views (full-text article views including HTML views, PDF and ePub downloads, according to the available data) and Abstracts Views on Vision4Press platform.
Data correspond to usage on the plateform after 2015. The current usage metrics is available 48-96 hours after online publication and is updated daily on week days.
Initial download of the metrics may take a while.