Free Access
Fig. 9.
Download original image
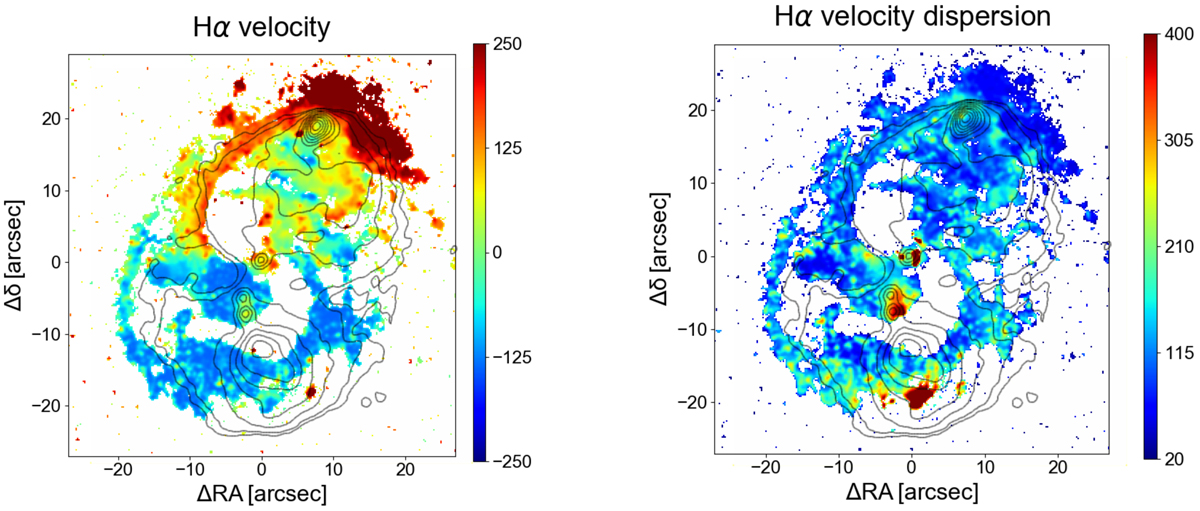
Velocity field (left) and velocity dispersion (not corrected for instrumental resolution, right), both in km s−1, of the ionized gas derived from the Hα emission line. We superposed the radio contours in both panels. Contours are drawn starting from 0.9 mJy beam−1 with geometric progression with a common ratio of 2.
Current usage metrics show cumulative count of Article Views (full-text article views including HTML views, PDF and ePub downloads, according to the available data) and Abstracts Views on Vision4Press platform.
Data correspond to usage on the plateform after 2015. The current usage metrics is available 48-96 hours after online publication and is updated daily on week days.
Initial download of the metrics may take a while.