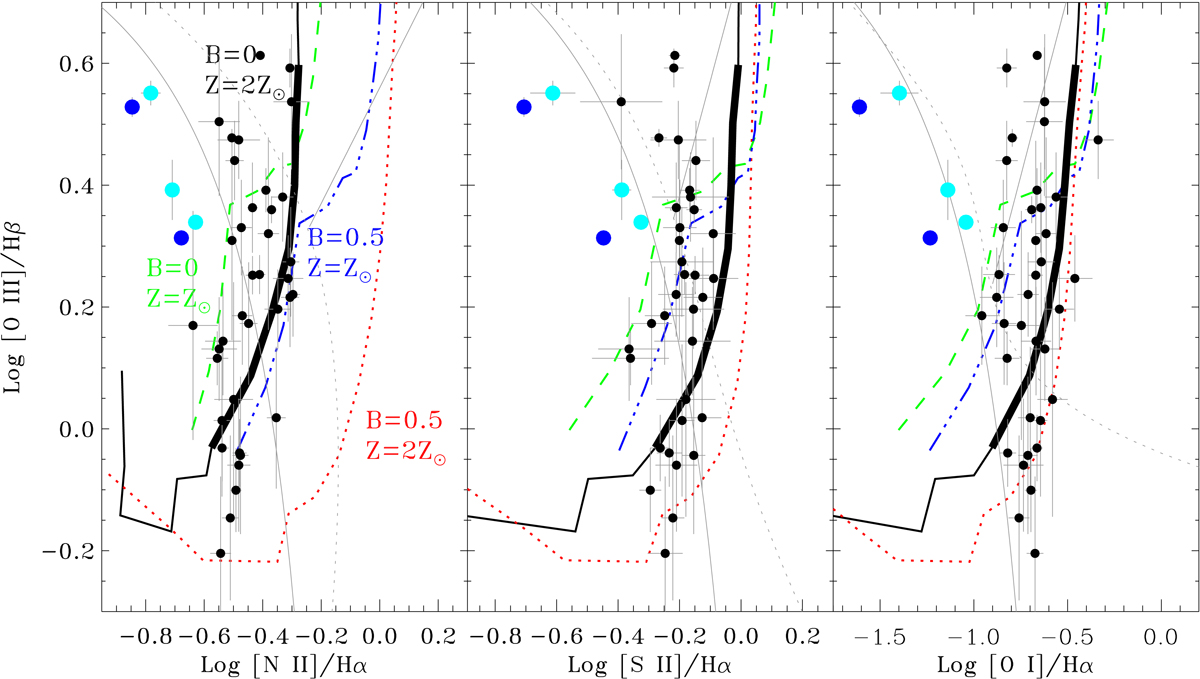
Fig. 8.
Download original image
Comparison between the predictions from models of ionization from fast shocks (Allen et al. 2008) and observed line ratios, limited to the regions outside the high-ionization bicone. The black curve shows the line ratios for a gas density of 1 cm−3, a metallicity Z = 2 × Z⊙, and a null magnetic field. The shock velocity ranges from 200 to 1000 km s−1 in steps of 25 km s−1, starting from the bottom left corner. The thick portion of the curve corresponds to the range vs = 350 − 500 km s−1. The dotted red lines are models with a magnetic field of 0.5 μG and Z = 2 × Z⊙. The green (dashed) and blue (dot-dashed) curves are the tracks obtained for a solar metallicity and B = 0 μG and B = 0.5 μG, respectively. The five large dots (coded as in Fig. 3) correspond to the compact knots of star formation (the cyan dots are the three knots in the outer filaments).
Current usage metrics show cumulative count of Article Views (full-text article views including HTML views, PDF and ePub downloads, according to the available data) and Abstracts Views on Vision4Press platform.
Data correspond to usage on the plateform after 2015. The current usage metrics is available 48-96 hours after online publication and is updated daily on week days.
Initial download of the metrics may take a while.