Fig. 7.
Download original image
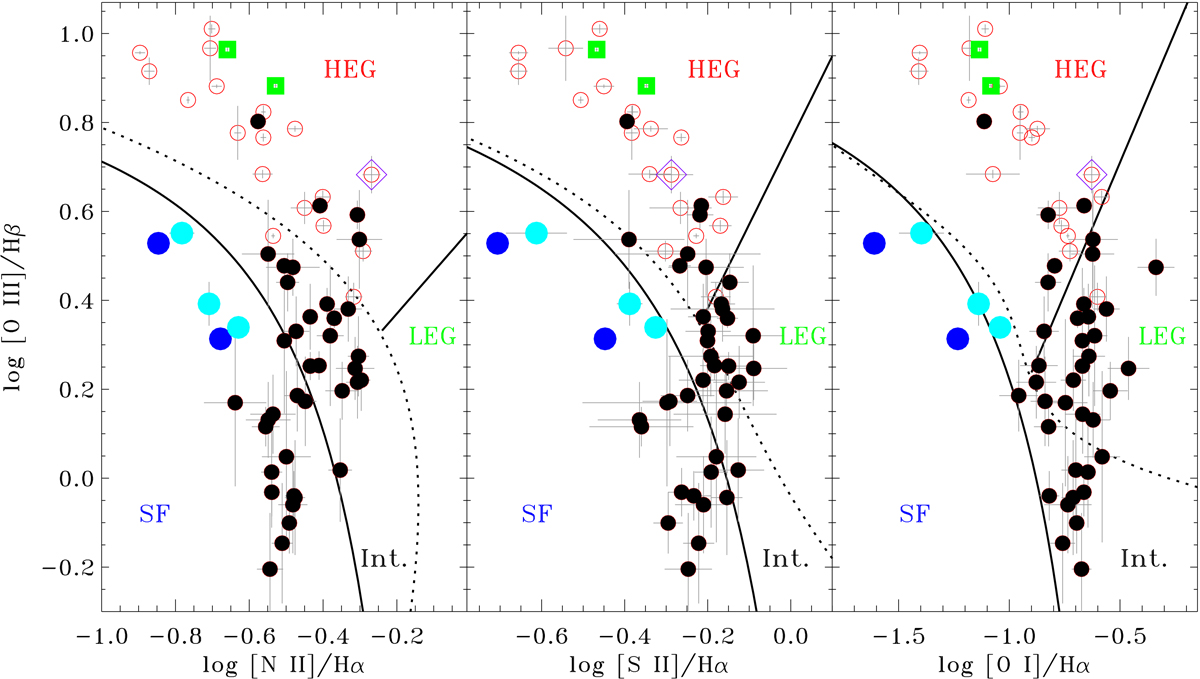
Location of the selected regions in the spectroscopic diagnostic diagrams. Filled black dots correspond to regions outside the high-ionization bicone, and the red empty dots are the regions inside the bicone (the nucleus is identified with an additional blue diamond). The five large dots correspond to the compact knots of star formation (the cyan dots are the three knots in the outer filaments). The green squares are associated with radio knots K1 and K2. The solid curves separate SF from intermediate galaxies (Int.), and the dotted curve separates intermediate galaxies from AGN. The black lines separate LEGs and HEGS (Law et al. 2021).
Current usage metrics show cumulative count of Article Views (full-text article views including HTML views, PDF and ePub downloads, according to the available data) and Abstracts Views on Vision4Press platform.
Data correspond to usage on the plateform after 2015. The current usage metrics is available 48-96 hours after online publication and is updated daily on week days.
Initial download of the metrics may take a while.