Fig. 5.
Download original image
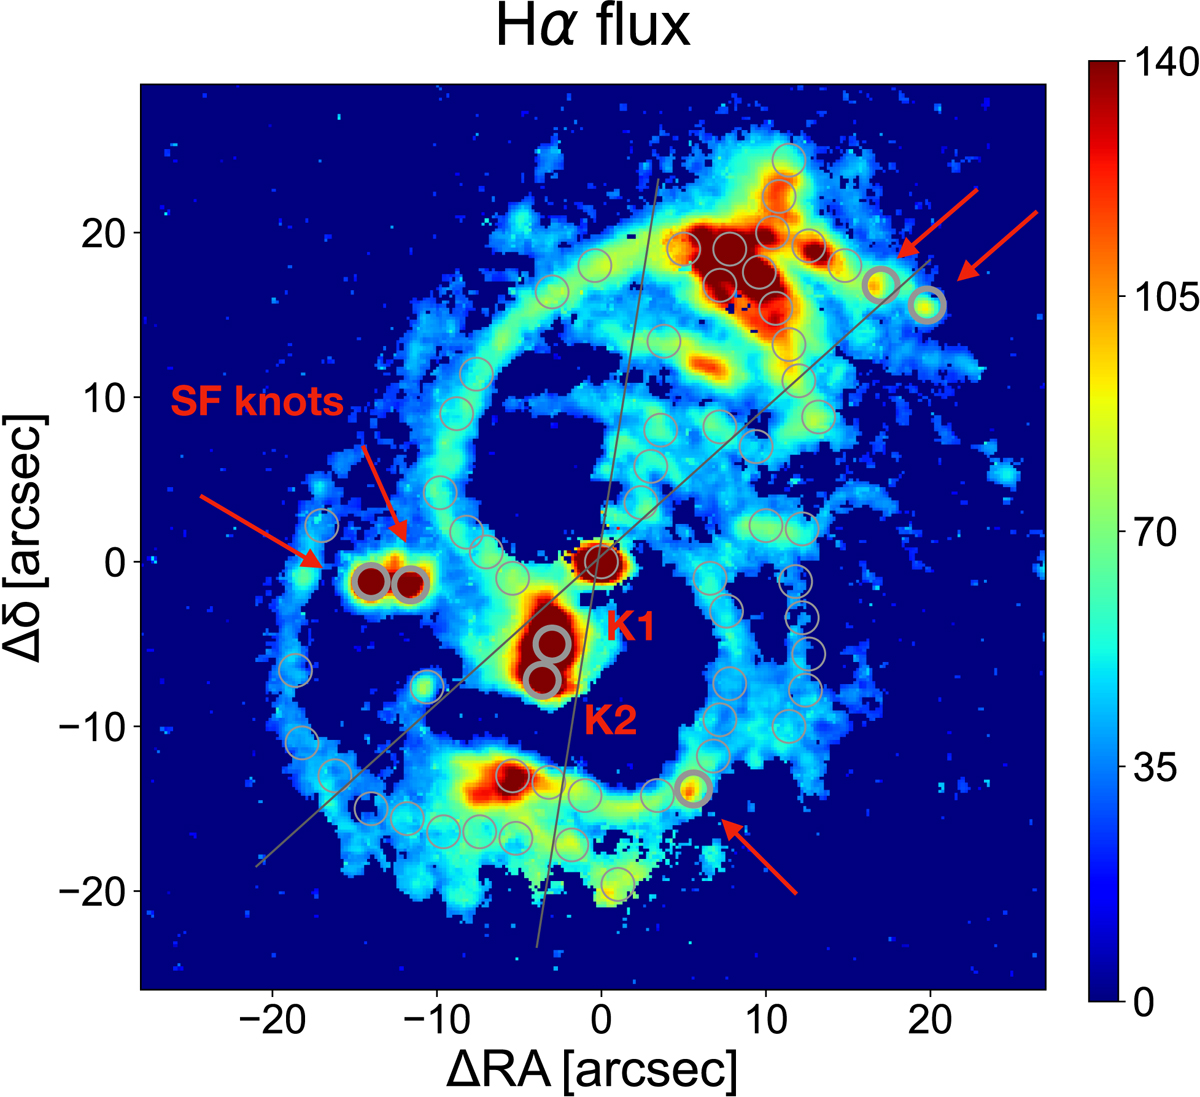
Hα image of Coma A showing the regions in which this line is detected at a 2σ level at least in single spaxels. We mark the locations from which we extracted the spectra (empty circles). We identify with red arrows the five compact knots of star formation and also mark the location of the radio knots K1 and K2. The gray lines mark the boundary of the high-ionization bicone. The color bar shown on the right side is in units of 10−18 erg s−1 cm−2 arcsec−2.
Current usage metrics show cumulative count of Article Views (full-text article views including HTML views, PDF and ePub downloads, according to the available data) and Abstracts Views on Vision4Press platform.
Data correspond to usage on the plateform after 2015. The current usage metrics is available 48-96 hours after online publication and is updated daily on week days.
Initial download of the metrics may take a while.