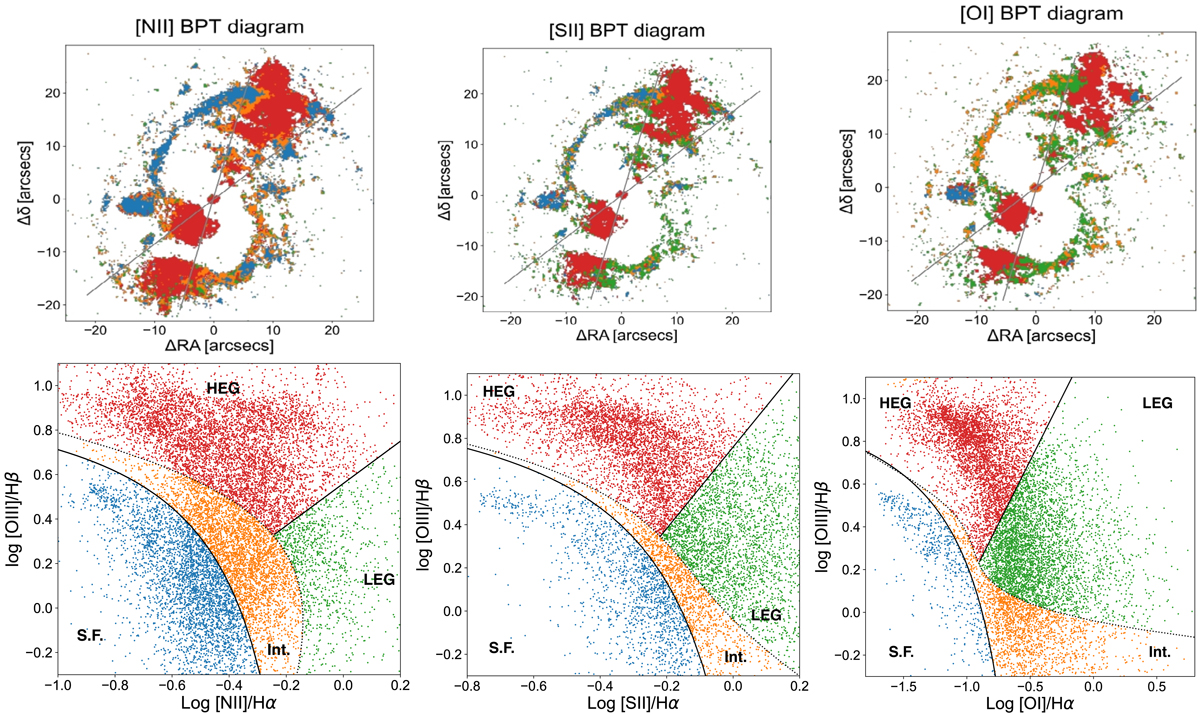
Fig. 4.
Download original image
Images obtained by color-coding the emission line regions depending on the location of the representative points in the diagnostic diagrams. Red shows high-excitation regions, green shows low-excitation regions, blue shows star-forming regions, and orange represents intermediate objects using the regions from Law et al. (2021). The images are defined where all four emission lines considered reach a 2σ level in a single spaxel. The gray lines mark the boundary of the high-ionization bicone.
Current usage metrics show cumulative count of Article Views (full-text article views including HTML views, PDF and ePub downloads, according to the available data) and Abstracts Views on Vision4Press platform.
Data correspond to usage on the plateform after 2015. The current usage metrics is available 48-96 hours after online publication and is updated daily on week days.
Initial download of the metrics may take a while.