Free Access
Fig. 2.
Download original image
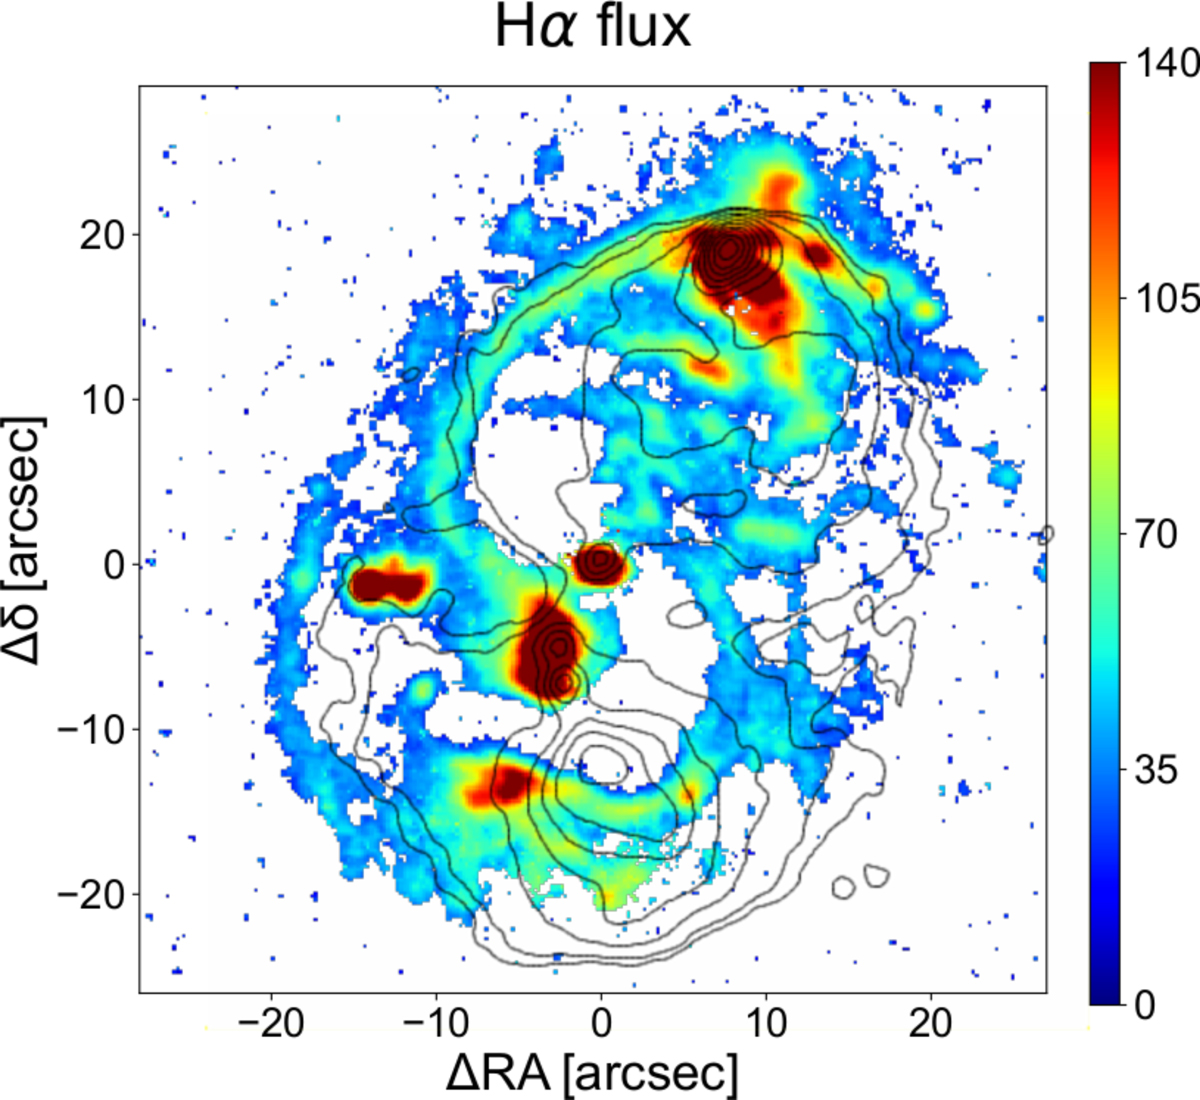
Distribution of the Hα line emission where this is detected at a 2σ level at least in single spaxels. The radio contours at 1.41 GHz are superposed. The lowest isocontour is at 0.9 mJy beam−1. The contours then follow a geometric progression with a common ratio of 2.
Current usage metrics show cumulative count of Article Views (full-text article views including HTML views, PDF and ePub downloads, according to the available data) and Abstracts Views on Vision4Press platform.
Data correspond to usage on the plateform after 2015. The current usage metrics is available 48-96 hours after online publication and is updated daily on week days.
Initial download of the metrics may take a while.