Free Access
Fig. 1.
Download original image
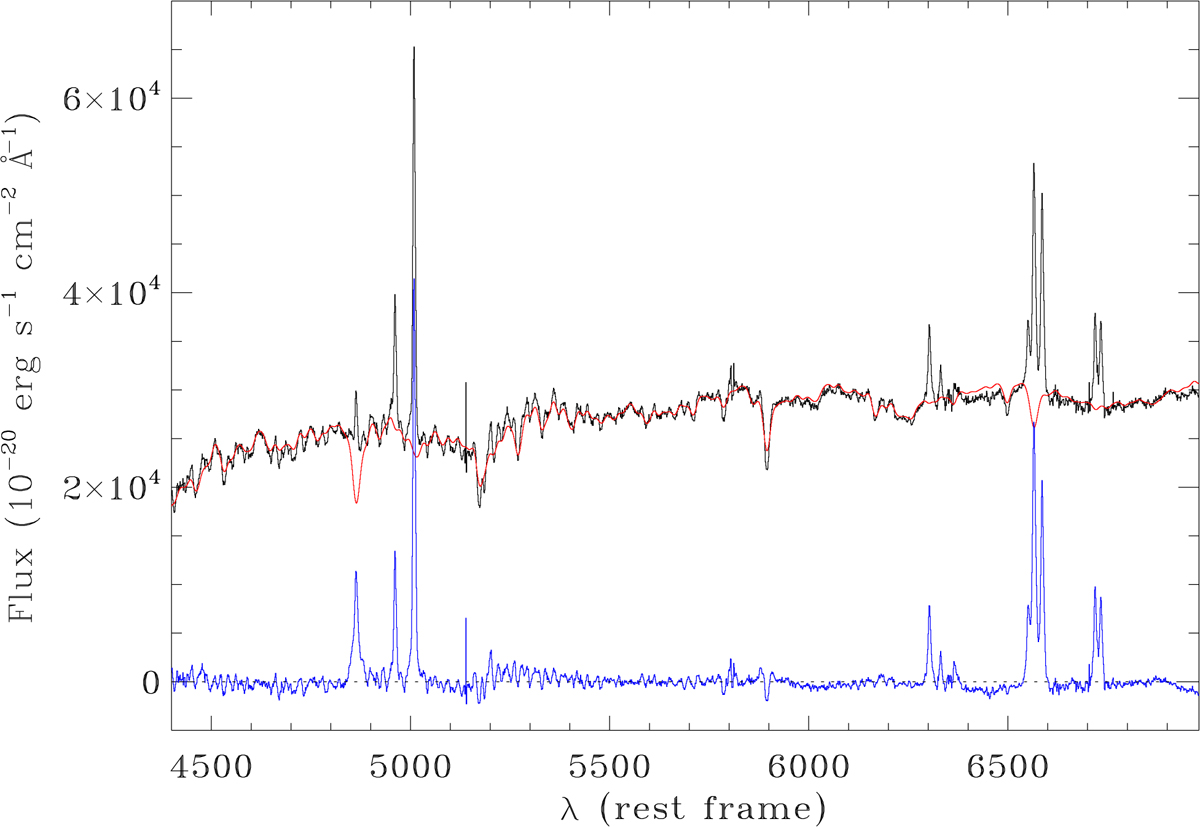
Example of subtraction of the stellar emission from the MUSE spectra. The black line is the spectrum extracted at the continuum peak, the red line is the best fit stellar continuum, the blue line represents the residuals after continuum subtraction showing the emission lines.
Current usage metrics show cumulative count of Article Views (full-text article views including HTML views, PDF and ePub downloads, according to the available data) and Abstracts Views on Vision4Press platform.
Data correspond to usage on the plateform after 2015. The current usage metrics is available 48-96 hours after online publication and is updated daily on week days.
Initial download of the metrics may take a while.