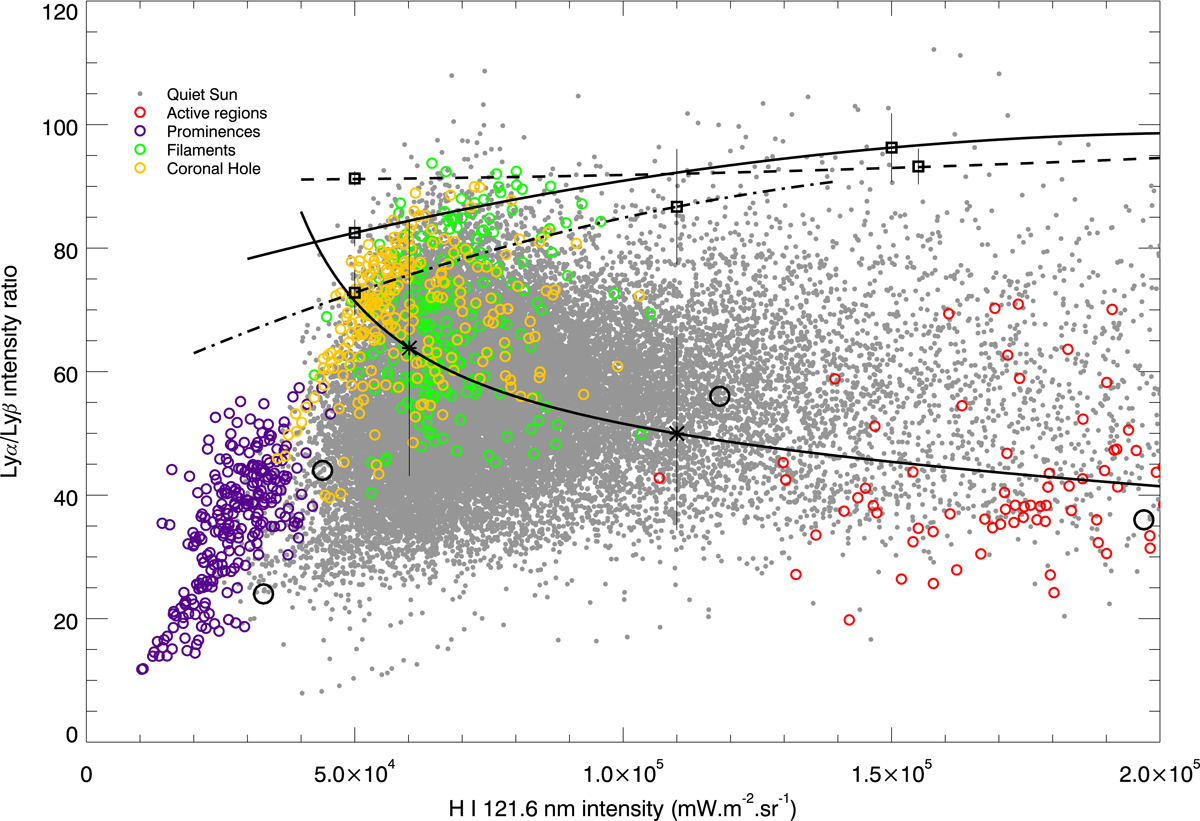
Fig. 8.
Download original image
Distribution of the H I Ly-α/Ly-β intensity ratio from the MXUVI image and the EIT image converted to Ly-β using Eq. (2). The dots and colored circles represent the measurements, which were performed at a period of minimum activity. The colored circles correspond to the different solar regions defined in Fig. 4. In order to maintain SI units, Ly-α intensities are expressed in mW m−2 sr−1, providing numerical values equivalent to the centimeter-gram-second units of erg s−1 cm−2 sr−1 used by Lemaire et al. (2012). The three-dotted-dashed line represents the H I Ly-α/Ly-β intensity ratio deduced from Eqs. (1) and (2). The stars with error bars give an estimate of the accuracy of the ratio. The three other lines are the fits from Fig. 2 of Lemaire et al. (2012). The solid and dashed lines correspond to two quiet-Sun observations, whereas the dotted-dashed line corresponds to a coronal hole. The squares with error bars on these lines give an estimation of the error for different ratio values on the three fits. The large black circles correspond to the ratio deduced from Patsourakos et al. (1998).
Current usage metrics show cumulative count of Article Views (full-text article views including HTML views, PDF and ePub downloads, according to the available data) and Abstracts Views on Vision4Press platform.
Data correspond to usage on the plateform after 2015. The current usage metrics is available 48-96 hours after online publication and is updated daily on week days.
Initial download of the metrics may take a while.